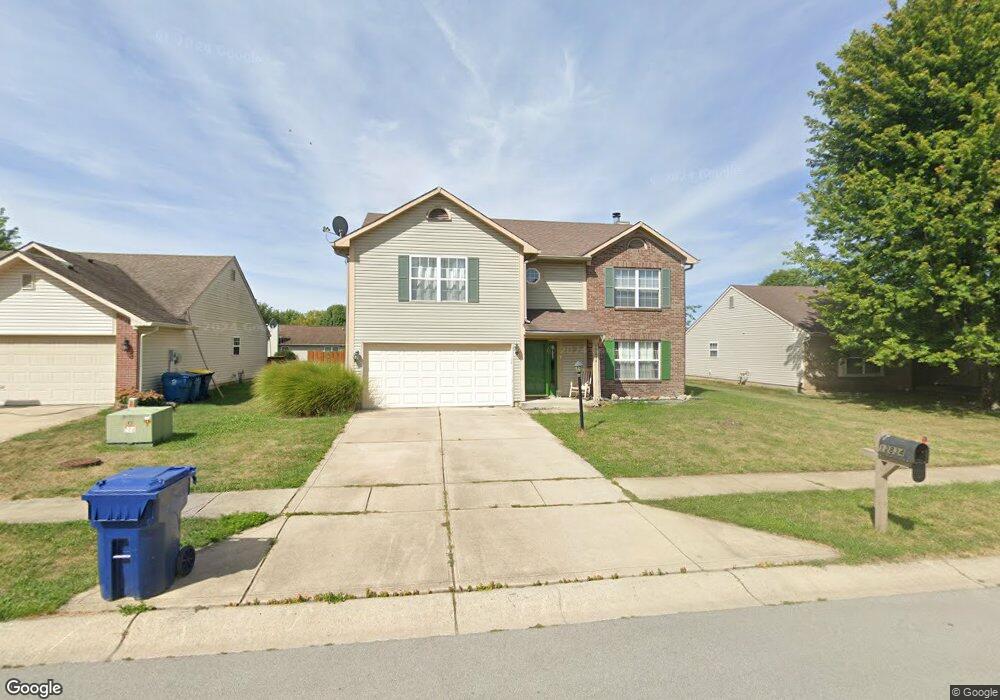
12834 Ramsgate Ct Fishers, IN 46038
Estimated Value: $357,000 - $380,000
4
Beds
3
Baths
2,332
Sq Ft
$158/Sq Ft
Est. Value
About This Home
This home is located at 12834 Ramsgate Ct, Fishers, IN 46038 and is currently estimated at $368,181, approximately $157 per square foot. 12834 Ramsgate Ct is a home located in Hamilton County with nearby schools including Cumberland Road Elementary School, East Middle School, and Fishers Junior High School.
Ownership History
Date
Name
Owned For
Owner Type
Purchase Details
Closed on
Dec 22, 2009
Sold by
Botros Nader and Botros Iman
Bought by
Botros Nader and Botros Eman
Current Estimated Value
Purchase Details
Closed on
Oct 6, 2005
Sold by
National City Mortgage Inc
Bought by
Botros Nader and Botros Iman
Home Financials for this Owner
Home Financials are based on the most recent Mortgage that was taken out on this home.
Original Mortgage
$109,000
Interest Rate
6.48%
Mortgage Type
Fannie Mae Freddie Mac
Purchase Details
Closed on
Jun 2, 2005
Sold by
Federal Home Loan Mortgage Corporation
Bought by
National City Mortgage Inc and National City Mortgage Co
Purchase Details
Closed on
Mar 15, 2005
Sold by
National City Mortgage Inc
Bought by
Federal Home Loan Mortgage Corporation
Purchase Details
Closed on
Feb 16, 2005
Sold by
Bartle David C and Bartle Patrice L
Bought by
National City Mortgage Co
Create a Home Valuation Report for This Property
The Home Valuation Report is an in-depth analysis detailing your home's value as well as a comparison with similar homes in the area
Home Values in the Area
Average Home Value in this Area
Purchase History
| Date | Buyer | Sale Price | Title Company |
|---|---|---|---|
| Botros Nader | -- | None Available | |
| Botros Nader | -- | Statewide Title Company Inc | |
| National City Mortgage Inc | -- | None Available | |
| Federal Home Loan Mortgage Corporation | -- | -- | |
| National City Mortgage Co | $130,500 | -- |
Source: Public Records
Mortgage History
| Date | Status | Borrower | Loan Amount |
|---|---|---|---|
| Previous Owner | Botros Nader | $109,000 |
Source: Public Records
Tax History Compared to Growth
Tax History
| Year | Tax Paid | Tax Assessment Tax Assessment Total Assessment is a certain percentage of the fair market value that is determined by local assessors to be the total taxable value of land and additions on the property. | Land | Improvement |
|---|---|---|---|---|
| 2024 | $3,139 | $297,100 | $36,700 | $260,400 |
| 2023 | $3,139 | $289,400 | $36,700 | $252,700 |
| 2022 | $3,118 | $265,600 | $36,700 | $228,900 |
| 2021 | $2,475 | $216,700 | $36,700 | $180,000 |
| 2020 | $2,142 | $193,300 | $36,700 | $156,600 |
| 2019 | $2,051 | $186,600 | $33,400 | $153,200 |
| 2018 | $1,935 | $178,800 | $33,400 | $145,400 |
| 2017 | $1,833 | $173,400 | $33,400 | $140,000 |
| 2016 | $1,747 | $168,300 | $33,400 | $134,900 |
| 2014 | $1,499 | $157,700 | $35,700 | $122,000 |
| 2013 | $1,499 | $159,100 | $35,700 | $123,400 |
Source: Public Records
Map
Nearby Homes
- 10066 Perlita Place
- 12991 Wingstem Ct
- 12959 Shandon Ln
- 11798 & 11842 E 131st St
- 12677 Ladson St
- 13068 Lamarque Place
- 10150 Beresford Ct
- 13125 Zinfandel Place
- 12966 Pleasant View Ln
- 13048 Ross Crossing
- 10175 Pamona Ct
- 10671 Pleasant View Ln
- 10513 Blue Springs Ln
- 10523 Hollowood Ct
- 10713 Summerwood Ln
- 12638 Granite Ridge Cir
- 12126 Blue Springs Ln
- 12783 Granite Ridge Cir
- 12662 Granite Ridge Cir
- 12807 Granite Ridge Cir
- 12842 Ramsgate Ct
- 12831 Patrick Ct
- 12824 Ramsgate Ct
- 12850 Ramsgate Ct
- 12839 Patrick Ct
- 12825 Patrick Ct
- 12825 Patrick Ct Unit 2
- 12833 Ramsgate Ct
- 12821 Patrick Ct
- 12847 Patrick Ct
- 12827 Ramsgate Ct
- 12841 Ramsgate Ct
- 12820 Ramsgate Ct
- 12823 Ramsgate Ct
- 12849 Ramsgate Ct
- 12817 Patrick Ct
- 12819 Ramsgate Ct
- 9912 Herald Square
- 9902 Herald Square
- 12909 Whitehaven Ln