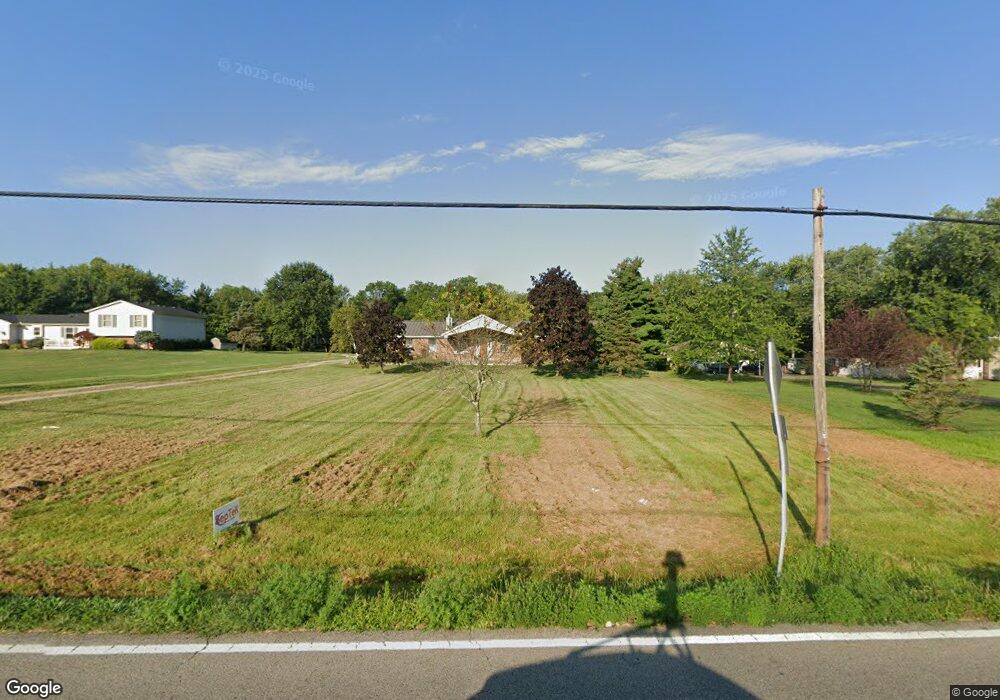
1285 Stubbs Mill Rd Lebanon, OH 45036
Estimated Value: $499,771 - $571,000
3
Beds
3
Baths
1,898
Sq Ft
$279/Sq Ft
Est. Value
About This Home
This home is located at 1285 Stubbs Mill Rd, Lebanon, OH 45036 and is currently estimated at $529,443, approximately $278 per square foot. 1285 Stubbs Mill Rd is a home located in Warren County with nearby schools including Bowman Primary School, Berry Intermediate School, and Donovan Elementary School.
Ownership History
Date
Name
Owned For
Owner Type
Purchase Details
Closed on
May 15, 2025
Sold by
Carroll Jeffrey D
Bought by
Carroll Jeffrey D and Carroll Jennifer A
Current Estimated Value
Purchase Details
Closed on
Jun 16, 2004
Sold by
Pacak Darice K
Bought by
Carroll Jeffrey D
Home Financials for this Owner
Home Financials are based on the most recent Mortgage that was taken out on this home.
Original Mortgage
$171,500
Interest Rate
5.37%
Mortgage Type
New Conventional
Purchase Details
Closed on
Feb 16, 1989
Sold by
Houston Houston and Houston James R
Bought by
Carroll Carroll and Carroll Jeffrey D
Purchase Details
Closed on
May 2, 1986
Sold by
D & D Investment Company
Bought by
Houston Houston and Houston James R
Purchase Details
Closed on
Apr 4, 1986
Sold by
Zecher Zecher and Zecher J.D.
Bought by
D & D Investment Company
Create a Home Valuation Report for This Property
The Home Valuation Report is an in-depth analysis detailing your home's value as well as a comparison with similar homes in the area
Home Values in the Area
Average Home Value in this Area
Purchase History
| Date | Buyer | Sale Price | Title Company |
|---|---|---|---|
| Carroll Jeffrey D | -- | None Listed On Document | |
| Carroll Jeffrey D | -- | Mid America Land Title | |
| Carroll Carroll | $119,900 | -- | |
| Houston Houston | $13,800 | -- | |
| D & D Investment Company | -- | -- |
Source: Public Records
Mortgage History
| Date | Status | Borrower | Loan Amount |
|---|---|---|---|
| Previous Owner | Carroll Jeffrey D | $171,500 | |
| Closed | Carroll Jeffrey D | $48,950 |
Source: Public Records
Tax History Compared to Growth
Tax History
| Year | Tax Paid | Tax Assessment Tax Assessment Total Assessment is a certain percentage of the fair market value that is determined by local assessors to be the total taxable value of land and additions on the property. | Land | Improvement |
|---|---|---|---|---|
| 2024 | $5,244 | $131,880 | $23,530 | $108,350 |
| 2023 | $4,822 | $109,588 | $16,037 | $93,551 |
| 2022 | $4,762 | $109,589 | $16,037 | $93,552 |
| 2021 | $4,419 | $109,589 | $16,037 | $93,552 |
| 2020 | $4,420 | $91,322 | $13,363 | $77,959 |
| 2019 | $4,445 | $91,322 | $13,363 | $77,959 |
| 2018 | $4,018 | $91,322 | $13,363 | $77,959 |
| 2017 | $4,040 | $82,432 | $12,044 | $70,389 |
| 2016 | $4,176 | $82,432 | $12,044 | $70,389 |
| 2015 | $4,209 | $82,432 | $12,044 | $70,389 |
| 2014 | $4,019 | $75,160 | $11,170 | $63,990 |
| 2013 | $4,014 | $89,430 | $12,890 | $76,540 |
Source: Public Records
Map
Nearby Homes
- 1405 Stubbs Mill Rd
- 455 Lake Haven Ct
- 447 Lake Haven Ct
- 440 Lake Shore Dr
- 420 Lake Shore Dr
- 1836 Stubbs Mill Rd
- 938 Whispering Pine Way
- 923 Greengate Dr
- 378 Forge Dr
- 1251 Poplar Hill Dr
- 1257 Poplar Hill Dr
- 538 Lookout Ridge Dr
- B Nelson Ln
- 1112 Mohawk Dr
- 781 Shadow Wood Dr
- 0 Wilmington Rd Unit 1850287
- 0 Wilmington Rd Unit 940450
- 2749 Jack Rd
- 1538 Oregonia Rd
- 2361 Wilmington Rd
- 1303 Stubbs Mill Rd
- 1363 Stubbs Mill Rd
- 1320 Stubbs Mill Rd
- 1219 Stubbs Mill Rd
- 1232 Stubbs Mill Rd
- 1262 Cook Rd
- 1356 Cook Rd
- 1320 Cook Rd
- 1392 Cook Rd
- 1414 Cook Rd
- 1189 Stubbs Mill Rd
- 1219 Cook Rd
- 1372 Stubbs Mill Rd
- 1391 Cook Rd
- 1415 Cook Rd
- 1431 Cook Rd
- 1349 Cook Rd
- 1406 Stubbs Mill Rd
- 1449 Cook Rd