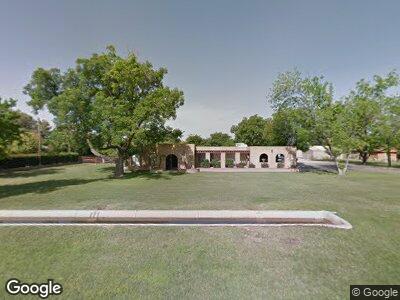
12850 S 71st St Tempe, AZ 85284
West Chandler NeighborhoodEstimated Value: $963,000 - $1,135,000
--
Bed
2
Baths
2,436
Sq Ft
$433/Sq Ft
Est. Value
About This Home
This home is located at 12850 S 71st St, Tempe, AZ 85284 and is currently estimated at $1,055,266, approximately $433 per square foot. 12850 S 71st St is a home located in Maricopa County with nearby schools including Kyrene de la Mariposa Elementary School, Kyrene del Pueblo Middle School, and Corona Del Sol High School.
Ownership History
Date
Name
Owned For
Owner Type
Purchase Details
Closed on
Aug 26, 1999
Sold by
Decker Elaine R and Decker Jana Bissell
Bought by
Hodgson John S and Hodgson Prudence B
Current Estimated Value
Home Financials for this Owner
Home Financials are based on the most recent Mortgage that was taken out on this home.
Original Mortgage
$352,000
Interest Rate
6.87%
Mortgage Type
New Conventional
Purchase Details
Closed on
Feb 21, 1994
Sold by
Legault Anthony G and Legault Dolores R
Bought by
Decker Blaine R and Decker Jana Bissell
Home Financials for this Owner
Home Financials are based on the most recent Mortgage that was taken out on this home.
Original Mortgage
$200,000
Interest Rate
7.38%
Mortgage Type
Purchase Money Mortgage
Create a Home Valuation Report for This Property
The Home Valuation Report is an in-depth analysis detailing your home's value as well as a comparison with similar homes in the area
Home Values in the Area
Average Home Value in this Area
Purchase History
| Date | Buyer | Sale Price | Title Company |
|---|---|---|---|
| Hodgson John S | $440,000 | Old Republic Title Agency | |
| Decker Blaine R | $253,000 | United Title Agency |
Source: Public Records
Mortgage History
| Date | Status | Borrower | Loan Amount |
|---|---|---|---|
| Open | Hodgson John S | $284,500 | |
| Closed | Hodgson John S | $300,000 | |
| Closed | Hodgson John S | $226,975 | |
| Closed | Hodgson John S | $208,900 | |
| Closed | Hodgson John S | $150,000 | |
| Closed | Hodgson John S | $300,700 | |
| Closed | Hodgson John S | $352,000 | |
| Previous Owner | Decker Blaine R | $200,000 |
Source: Public Records
Tax History Compared to Growth
Tax History
| Year | Tax Paid | Tax Assessment Tax Assessment Total Assessment is a certain percentage of the fair market value that is determined by local assessors to be the total taxable value of land and additions on the property. | Land | Improvement |
|---|---|---|---|---|
| 2025 | $4,703 | $50,176 | -- | -- |
| 2024 | $4,574 | $47,787 | -- | -- |
| 2023 | $4,574 | $66,910 | $13,380 | $53,530 |
| 2022 | $4,334 | $50,970 | $10,190 | $40,780 |
| 2021 | $4,445 | $49,850 | $9,970 | $39,880 |
| 2020 | $4,333 | $47,050 | $9,410 | $37,640 |
| 2019 | $4,186 | $43,800 | $8,760 | $35,040 |
| 2018 | $4,041 | $37,670 | $7,530 | $30,140 |
| 2017 | $3,863 | $36,000 | $7,200 | $28,800 |
| 2016 | $3,902 | $34,960 | $6,990 | $27,970 |
| 2015 | $3,573 | $35,580 | $7,110 | $28,470 |
Source: Public Records
Map
Nearby Homes
- 9414 S La Rosa Dr
- 211 E Dawn Dr
- 9445 S La Rosa Dr Unit II
- 843 E Vera Ln
- 1020 E Caroline Ln
- 8863 S Grandview Dr
- 76 E Calle de Arcos
- 8675 S College Ln
- 5 W Ranch Rd
- 67 W Sarah Ln
- 105 E Los Arboles Dr
- 514 E Yvonne Ln
- 50 W Calle de Arcos
- 8781 S Mill Ave
- 63 W Los Arboles Dr
- 8373 S Forest Ave
- 9575 S Ash Ave
- 4640 W Gail Dr
- 8336 S Homestead Ln
- 192 W Los Arboles Dr
- 12850 S 71st St
- 13002 S 71st St
- 12830 S 71st St
- 12849 S 71st St
- 13001 S 71st St
- 13010 S 71st St Unit 1400
- 13010 S 71st St
- 12816 S 71st St
- 12831 S 71st St
- 12831 S 71st St Unit 11
- 12825 S 71st St
- 13030 S 71st St
- 9210 S Rural Rd
- 9210 S Rural Rd Unit 11
- 9210 S Rural Rd
- 9390 S Rural Rd
- 308 E Dawn Dr
- 316 E Caroline Ln
- 13050 S 71st St
- 283 E Dawn Dr