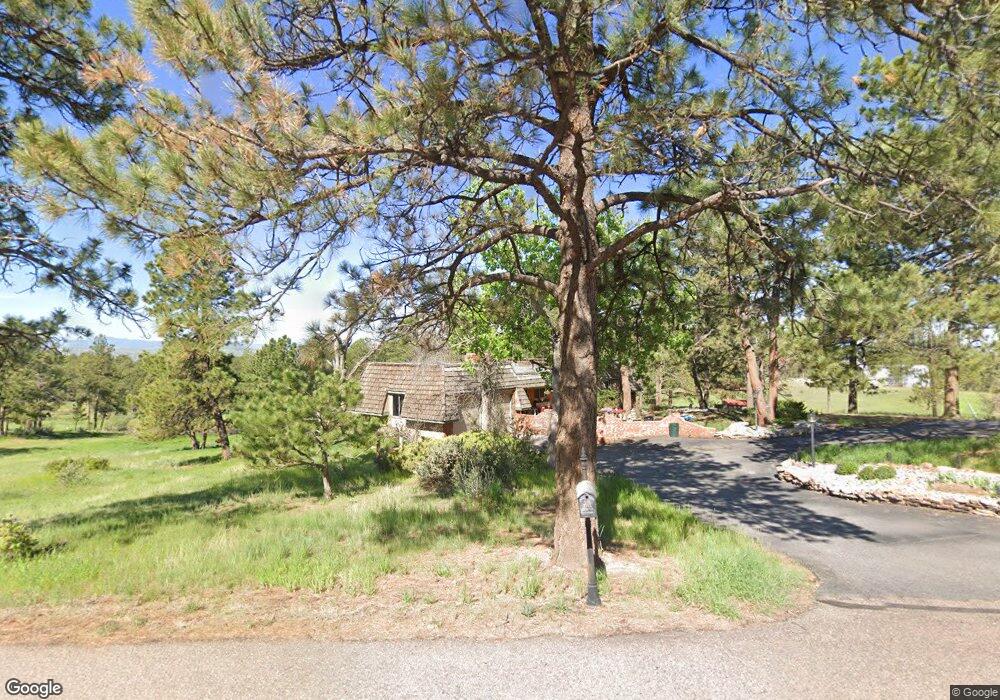
12851 N Lost Canyon Trail Parker, CO 80138
Ponderosa Hills NeighborhoodEstimated Value: $925,000 - $982,000
3
Beds
2
Baths
2,595
Sq Ft
$368/Sq Ft
Est. Value
About This Home
This home is located at 12851 N Lost Canyon Trail, Parker, CO 80138 and is currently estimated at $955,583, approximately $368 per square foot. 12851 N Lost Canyon Trail is a home located in Douglas County with nearby schools including Pine Lane Elementary School, Sierra Middle School, and Chaparral High School.
Ownership History
Date
Name
Owned For
Owner Type
Purchase Details
Closed on
Jul 8, 2020
Sold by
Squires Robin C and Squires Linda N
Bought by
Squires Dylan A
Current Estimated Value
Home Financials for this Owner
Home Financials are based on the most recent Mortgage that was taken out on this home.
Original Mortgage
$320,000
Outstanding Balance
$283,755
Interest Rate
3.1%
Mortgage Type
New Conventional
Estimated Equity
$671,828
Purchase Details
Closed on
Sep 8, 2004
Sold by
Mary Jane Shuey Trust
Bought by
Squires Robin C and Squires Linda N
Home Financials for this Owner
Home Financials are based on the most recent Mortgage that was taken out on this home.
Original Mortgage
$337,600
Interest Rate
3.87%
Mortgage Type
Unknown
Purchase Details
Closed on
Apr 21, 2004
Sold by
Shuey Mary Jane
Bought by
Mary Jane Shuey Trust
Purchase Details
Closed on
Jun 15, 1967
Sold by
Ponderosa Hills Inc
Bought by
Shuey Philip C and Shuey Mary Jane
Create a Home Valuation Report for This Property
The Home Valuation Report is an in-depth analysis detailing your home's value as well as a comparison with similar homes in the area
Home Values in the Area
Average Home Value in this Area
Purchase History
| Date | Buyer | Sale Price | Title Company |
|---|---|---|---|
| Squires Dylan A | $425,000 | Heritage Title Company | |
| Squires Robin C | $422,000 | Chicago Title Co | |
| Mary Jane Shuey Trust | -- | -- | |
| Shuey Philip C | -- | -- |
Source: Public Records
Mortgage History
| Date | Status | Borrower | Loan Amount |
|---|---|---|---|
| Open | Squires Dylan A | $320,000 | |
| Previous Owner | Squires Robin C | $337,600 |
Source: Public Records
Tax History Compared to Growth
Tax History
| Year | Tax Paid | Tax Assessment Tax Assessment Total Assessment is a certain percentage of the fair market value that is determined by local assessors to be the total taxable value of land and additions on the property. | Land | Improvement |
|---|---|---|---|---|
| 2024 | $4,806 | $61,260 | $32,100 | $29,160 |
| 2023 | $4,860 | $61,260 | $32,100 | $29,160 |
| 2022 | $3,867 | $47,950 | $24,540 | $23,410 |
| 2021 | $4,028 | $47,950 | $24,540 | $23,410 |
| 2020 | $3,519 | $42,900 | $21,900 | $21,000 |
| 2019 | $3,532 | $42,900 | $21,900 | $21,000 |
| 2018 | $3,078 | $36,740 | $17,860 | $18,880 |
| 2017 | $2,849 | $36,740 | $17,860 | $18,880 |
| 2016 | $2,746 | $34,670 | $15,120 | $19,550 |
| 2015 | $1,408 | $34,670 | $15,120 | $19,550 |
| 2014 | $1,354 | $29,810 | $12,340 | $17,470 |
Source: Public Records
Map
Nearby Homes
- 8890 S Quatar Ct
- Salerno Plan at Inspiration - Hilltop 55+
- Virtue Plan at Inspiration - Hilltop 55+
- Ferrara Plan at Inspiration - Hilltop 55+
- Preserve Plan at Inspiration - Hilltop 55+
- Sanctuary Plan at Inspiration - Hilltop 55+
- 8844 S Quemoy Ct
- 9035 S Shawnee Ct
- 8925 S Riviera Way
- 9046 S Shawnee Ct
- 8905 S Riviera Way
- 9036 S Shawnee Ct
- 8878 S Riviera Ct
- 8895 S Riviera Way
- 8902 S Riviera Way
- 8831 S Quemoy St
- 8758 S Quatar St
- 8792 S Quemoy St
- 8664 S Quemoy St
- 7330 Centennial Dr
- 12868 N Lost Canyon Trail
- 12787 N Lost Canyon Trail
- 12911 N Lost Canyon Trail
- 12782 N Lost Canyon Trail
- 12965 N Lost Canyon Trail
- 7536 Inspiration Dr
- 7581 E Summit Rd
- 7580 E Summit Rd
- 7590 Inspiration Dr
- 12725 N Lost Canyon Trail
- 7374 Inspiration Dr
- 12710 N Lost Canyon Trail
- 7633 E Summit Rd
- 0 E Inspiration Dr
- 000001 E Inspiration Dr
- 0000000 E Inspiration Dr
- 7634 E Summit Rd
- 7591 Ponderosa Cir
- 7648 Inspiration Dr
- 7543 Inspiration Dr