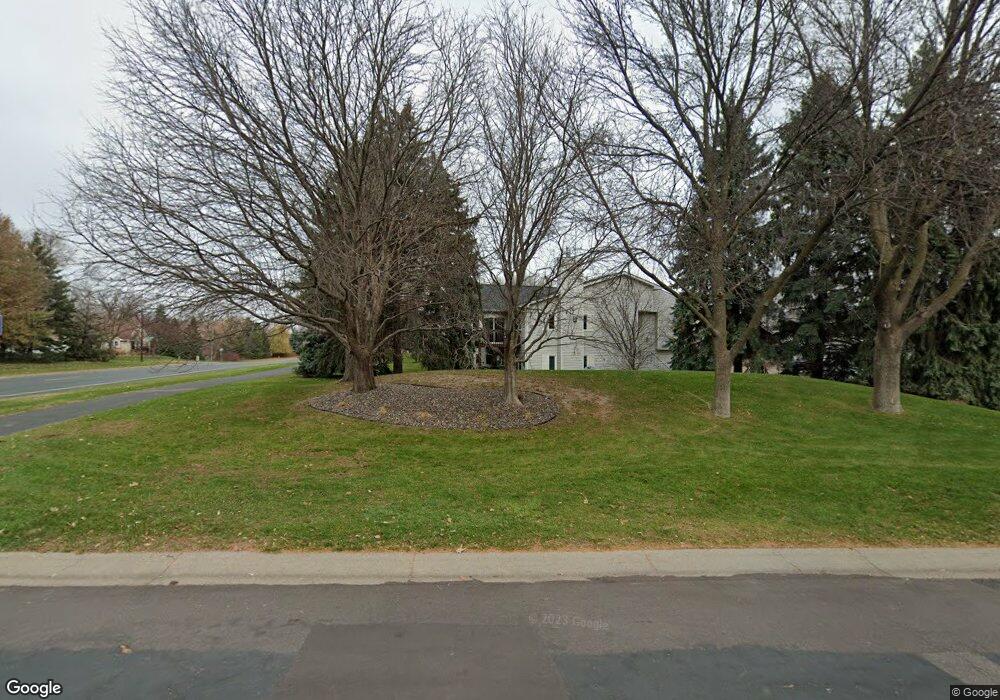
12878 82nd Place N Maple Grove, MN 55369
Estimated Value: $279,719 - $302,000
3
Beds
2
Baths
1,127
Sq Ft
$255/Sq Ft
Est. Value
About This Home
This home is located at 12878 82nd Place N, Maple Grove, MN 55369 and is currently estimated at $287,180, approximately $254 per square foot. 12878 82nd Place N is a home located in Hennepin County with nearby schools including Rice Lake Elementary School, Maple Grove Middle School, and Maple Grove Senior High School.
Ownership History
Date
Name
Owned For
Owner Type
Purchase Details
Closed on
Jun 23, 2017
Sold by
Panitzke Brady D and Panitzke Teri K
Bought by
Paquin Alex and Paquin Kala
Current Estimated Value
Home Financials for this Owner
Home Financials are based on the most recent Mortgage that was taken out on this home.
Original Mortgage
$173,850
Outstanding Balance
$144,726
Interest Rate
4.05%
Mortgage Type
New Conventional
Estimated Equity
$142,454
Purchase Details
Closed on
Apr 25, 2006
Sold by
Leith Beth M and Leith Phillip G
Bought by
Panitzke Brady
Purchase Details
Closed on
Jul 29, 1999
Sold by
Coldagelli John F and Coldagelli Joney L
Bought by
Symens Thomas D and Symens Beth M
Create a Home Valuation Report for This Property
The Home Valuation Report is an in-depth analysis detailing your home's value as well as a comparison with similar homes in the area
Home Values in the Area
Average Home Value in this Area
Purchase History
| Date | Buyer | Sale Price | Title Company |
|---|---|---|---|
| Paquin Alex | $183,000 | Title Specialists Inc | |
| Panitzke Brady | $201,500 | -- | |
| Symens Thomas D | $116,900 | -- |
Source: Public Records
Mortgage History
| Date | Status | Borrower | Loan Amount |
|---|---|---|---|
| Open | Paquin Alex | $173,850 |
Source: Public Records
Tax History Compared to Growth
Tax History
| Year | Tax Paid | Tax Assessment Tax Assessment Total Assessment is a certain percentage of the fair market value that is determined by local assessors to be the total taxable value of land and additions on the property. | Land | Improvement |
|---|---|---|---|---|
| 2024 | $3,233 | $265,000 | $48,200 | $216,800 |
| 2023 | $3,265 | $278,100 | $64,500 | $213,600 |
| 2022 | $2,564 | $253,400 | $27,800 | $225,600 |
| 2021 | $2,699 | $211,300 | $24,800 | $186,500 |
| 2020 | $2,362 | $218,700 | $39,200 | $179,500 |
| 2019 | $2,294 | $197,400 | $30,700 | $166,700 |
| 2018 | $2,184 | $183,200 | $31,800 | $151,400 |
| 2017 | $2,368 | $161,700 | $36,500 | $125,200 |
| 2016 | $2,151 | $144,800 | $31,500 | $113,300 |
| 2015 | $2,211 | $144,800 | $35,000 | $109,800 |
| 2014 | -- | $120,700 | $30,000 | $90,700 |
Source: Public Records
Map
Nearby Homes
- 8326 Oakview Ct N
- 12775 82nd Place N
- 8405 Norwood Ln N
- 12598 84th Place N
- 13611 86th Ave N
- 8406 Jonquil Ln N
- 12509 88th Ave N
- 13870 85th Ave N
- 11879 85th Place N Unit 54
- 8487 Rice Lake Rd
- 11601 82nd Ave N
- 14085 85th Place N
- 14023 81st Ave N
- 8949 Rosewood Ln N
- 14067 81st Ave N
- 11540 81st Place N
- 13590 89th Ave N
- 11462 81st Place N
- 11760 88th Place N
- 11631 88th Ave N
- 12874 82nd Place N
- 12882 82nd Place N
- 12886 82nd Place N
- 12870 82nd Place N
- 12890 82nd Place N
- 12852 82nd Place N
- 12848 82nd Place N
- 12844 82nd Place N
- 12816 82nd Place N
- 12816 82nd Place N Unit 90-5
- 12812 82nd Place N
- 12820 82nd Place N
- 12808 82nd Place N
- 12840 82nd Place N
- 12804 82nd Place N
- 12800 82nd Place N
- 12915 83rd Ave N
- 8327 Oakview Ct N
- 8331 Oakview Ct N
- 12782 82nd Place N