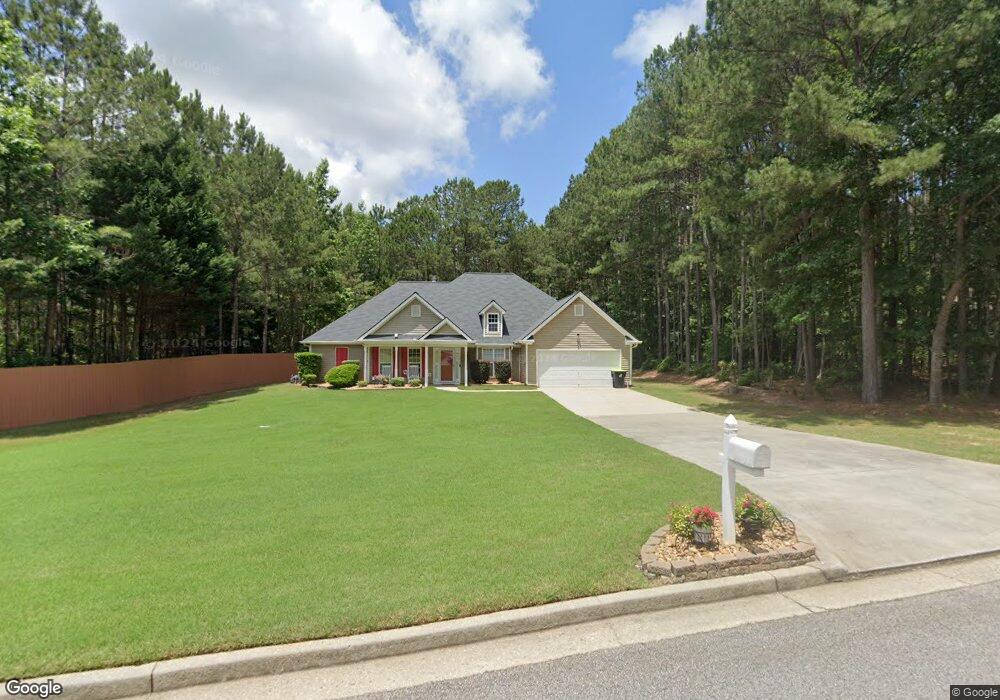
12885 Simmons Rd Hampton, GA 30228
Estimated Value: $299,428 - $352,000
4
Beds
3
Baths
2,079
Sq Ft
$155/Sq Ft
Est. Value
About This Home
This home is located at 12885 Simmons Rd, Hampton, GA 30228 and is currently estimated at $322,857, approximately $155 per square foot. 12885 Simmons Rd is a home located in Clayton County with nearby schools including River's Edge Elementary School, Eddie White Academy, and Lovejoy High School.
Ownership History
Date
Name
Owned For
Owner Type
Purchase Details
Closed on
Jan 11, 2007
Sold by
Flanders Judith A
Bought by
Jones Charles A
Current Estimated Value
Home Financials for this Owner
Home Financials are based on the most recent Mortgage that was taken out on this home.
Original Mortgage
$202,500
Outstanding Balance
$118,076
Interest Rate
6.05%
Mortgage Type
VA
Estimated Equity
$204,781
Purchase Details
Closed on
Dec 3, 2003
Sold by
Beta Const Inc
Bought by
Flanders Judith A
Home Financials for this Owner
Home Financials are based on the most recent Mortgage that was taken out on this home.
Original Mortgage
$176,177
Interest Rate
5.82%
Mortgage Type
VA
Purchase Details
Closed on
Jul 16, 2003
Sold by
Chandler Thomas B
Bought by
Beta Const Inc
Home Financials for this Owner
Home Financials are based on the most recent Mortgage that was taken out on this home.
Original Mortgage
$119,900
Interest Rate
5.16%
Create a Home Valuation Report for This Property
The Home Valuation Report is an in-depth analysis detailing your home's value as well as a comparison with similar homes in the area
Home Values in the Area
Average Home Value in this Area
Purchase History
| Date | Buyer | Sale Price | Title Company |
|---|---|---|---|
| Jones Charles A | $202,500 | -- | |
| Flanders Judith A | $176,600 | -- | |
| Beta Const Inc | $25,000 | -- |
Source: Public Records
Mortgage History
| Date | Status | Borrower | Loan Amount |
|---|---|---|---|
| Open | Jones Charles A | $202,500 | |
| Previous Owner | Flanders Judith A | $176,177 | |
| Previous Owner | Beta Const Inc | $119,900 |
Source: Public Records
Tax History
| Year | Tax Paid | Tax Assessment Tax Assessment Total Assessment is a certain percentage of the fair market value that is determined by local assessors to be the total taxable value of land and additions on the property. | Land | Improvement |
|---|---|---|---|---|
| 2025 | $2,231 | $126,880 | $10,400 | $116,480 |
| 2024 | $2,413 | $131,920 | $10,400 | $121,520 |
| 2023 | $4,662 | $129,120 | $10,400 | $118,720 |
| 2022 | $1,942 | $108,520 | $10,400 | $98,120 |
| 2021 | $1,429 | $80,960 | $10,400 | $70,560 |
| 2020 | $1,389 | $77,167 | $10,400 | $66,767 |
| 2019 | $1,394 | $75,455 | $10,400 | $65,055 |
| 2018 | $1,337 | $72,713 | $10,400 | $62,313 |
| 2017 | $1,184 | $62,716 | $10,400 | $52,316 |
| 2016 | $978 | $53,160 | $10,400 | $42,760 |
| 2015 | $849 | $0 | $0 | $0 |
| 2014 | $1,470 | $45,788 | $10,400 | $35,388 |
Source: Public Records
Map
Nearby Homes
- 829 Sweden Forest Cove
- 644 Hampton Rd
- 13128 Rangeley Hills Dr
- 1083 Hampton Rd
- 0 Panhandle Rd Unit LOT 1 10559919
- 0 Panhandle Rd Unit LOT 4 10559933
- 0 Panhandle Rd Unit LOT 3 10559926
- 12391 Hillcrest Dr
- 12328 Edgewater Dr
- 12275 Styron Dr
- 12283 Coldstream Ct
- 904 Inman Ave
- 12216 Edgewater Dr
- 526 Canady Ct
- 12237 Dickson Rd Unit 1
- 12123 Edgewater Dr
- 12140 Dominion Dr
- 12402 Muir Field Ct
- 11961 Markham Way
- 12090 Centerra Dr
- 12871 Simmons Rd
- 825 Holland Ct
- 12870 Simmons Rd
- 1117 Holland Ct
- 12888 Simmons Rd
- 778 Hampton Rd
- 12850 Simmons Rd
- 817 Holland Ct
- 12935 Woolwich Ln
- 1104 Holland Ct
- 12838 Simmons Rd
- 12838 Simmons Rd Unit 92
- 820 Holland Ct
- 12946 Woolwich Ln
- 813 Holland Ct
- 12838 Panhandle Rd
- 12872 Panhandle Rd
- 12819 Simmons Rd
- 12854 Panhandle Rd
- 12826 Simmons Rd
Your Personal Tour Guide
Ask me questions while you tour the home.