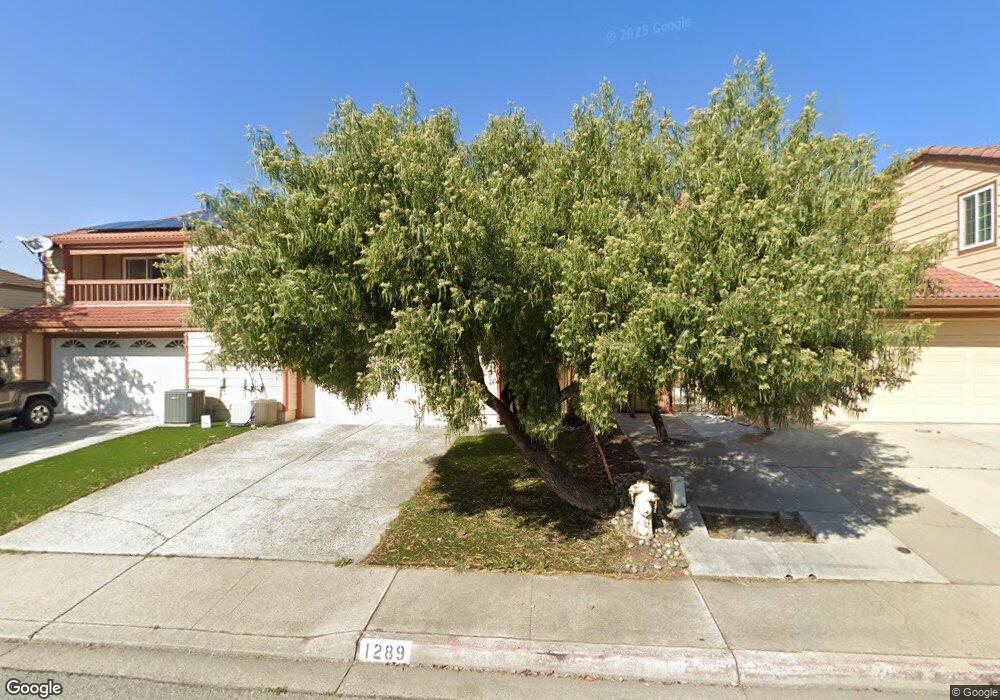
1289 Chewpon Ave Milpitas, CA 95035
Estimated Value: $1,331,000 - $1,489,000
2
Beds
3
Baths
1,503
Sq Ft
$937/Sq Ft
Est. Value
About This Home
This home is located at 1289 Chewpon Ave, Milpitas, CA 95035 and is currently estimated at $1,407,899, approximately $936 per square foot. 1289 Chewpon Ave is a home located in Santa Clara County with nearby schools including John Sinnott Elementary School, Rancho Milpitas Middle School, and Milpitas High School.
Ownership History
Date
Name
Owned For
Owner Type
Purchase Details
Closed on
Sep 10, 2003
Sold by
Le Nuong D and Le Nancy
Bought by
Rofe Mai Do
Current Estimated Value
Purchase Details
Closed on
Nov 22, 2002
Sold by
Pham Thanh D and Le Nuong D
Bought by
Le Nuong D
Home Financials for this Owner
Home Financials are based on the most recent Mortgage that was taken out on this home.
Original Mortgage
$334,000
Interest Rate
6.12%
Purchase Details
Closed on
Nov 6, 2000
Sold by
Le Nuong D and Pham Thanh Duy
Bought by
Le Nuong D
Purchase Details
Closed on
Feb 1, 2000
Sold by
Bersamin Jesus V and Bersamin Generosa L
Bought by
Pham Thanh D and Le Nuong D
Home Financials for this Owner
Home Financials are based on the most recent Mortgage that was taken out on this home.
Original Mortgage
$268,800
Interest Rate
7.87%
Purchase Details
Closed on
May 17, 1995
Sold by
Chirico Christine P and Chirico Paul E
Bought by
Bersamin Jesus and Bersamin Generosa L
Home Financials for this Owner
Home Financials are based on the most recent Mortgage that was taken out on this home.
Original Mortgage
$172,800
Interest Rate
7.25%
Create a Home Valuation Report for This Property
The Home Valuation Report is an in-depth analysis detailing your home's value as well as a comparison with similar homes in the area
Home Values in the Area
Average Home Value in this Area
Purchase History
| Date | Buyer | Sale Price | Title Company |
|---|---|---|---|
| Rofe Mai Do | $432,000 | Alliance Title Company | |
| Le Nuong D | -- | Alliance Title Company | |
| Le Nuong D | -- | -- | |
| Le Diem Nuong Thi | -- | -- | |
| Pham Thanh D | $336,000 | Chicago Title Co | |
| Bersamin Jesus | $192,000 | North American Title Company |
Source: Public Records
Mortgage History
| Date | Status | Borrower | Loan Amount |
|---|---|---|---|
| Previous Owner | Le Nuong D | $334,000 | |
| Previous Owner | Pham Thanh D | $268,800 | |
| Previous Owner | Bersamin Jesus | $172,800 |
Source: Public Records
Tax History
| Year | Tax Paid | Tax Assessment Tax Assessment Total Assessment is a certain percentage of the fair market value that is determined by local assessors to be the total taxable value of land and additions on the property. | Land | Improvement |
|---|---|---|---|---|
| 2025 | $7,072 | $614,194 | $284,350 | $329,844 |
| 2024 | $7,072 | $602,152 | $278,775 | $323,377 |
| 2023 | $7,048 | $590,346 | $273,309 | $317,037 |
| 2022 | $7,019 | $578,771 | $267,950 | $310,821 |
| 2021 | $6,917 | $567,424 | $262,697 | $304,727 |
| 2020 | $6,796 | $561,607 | $260,004 | $301,603 |
| 2019 | $6,719 | $550,596 | $254,906 | $295,690 |
| 2018 | $6,382 | $539,801 | $249,908 | $289,893 |
| 2017 | $6,299 | $529,217 | $245,008 | $284,209 |
| 2016 | $6,043 | $518,841 | $240,204 | $278,637 |
| 2015 | $5,981 | $511,048 | $236,596 | $274,452 |
| 2014 | $5,815 | $501,038 | $231,962 | $269,076 |
Source: Public Records
Map
Nearby Homes
- 1039 Big Bear Ct
- 997 Courtland Ct
- 1430 Cuciz Ln
- 1490 Mount Diablo Ave
- 1361 Highland Ct
- 672 Amalfi Loop
- 1759 Tahoe Dr
- 484 Dempsey Rd Unit 186
- 496 Dempsey Rd Unit 199
- 931 Galindo Ct
- 2152 Ashwood Ln
- 2144 Ashwood Ln
- 2085 Ashwood Ln
- 2074 Ashwood Ln
- 380 Riesling Ave Unit 21
- 1625 Delano St Unit 23
- 2006 Terracotta Ct
- 430 Montague Expy Unit 20
- 330 Riesling Ave Unit 23
- 3398 Landess Ave Unit D
- 1291 Chewpon Ave
- 1287 Chewpon Ave
- 1293 Chewpon Ave
- 1057 Big Bear Ct
- 1295 Chewpon Ave
- 1062 Dempsey Rd
- 1064 Dempsey Rd
- 1060 Dempsey Rd
- 1051 Big Bear Ct
- 1058 Dempsey Rd
- 1297 Chewpon Ave
- 1292 Chewpon Ave
- 1052 Dempsey Rd
- 1045 Big Bear Ct
- 1294 Chewpon Ave
- 1290 Chewpon Ave
- 1068 Dempsey Rd
- 1067 Hay Ct
- 1299 Chewpon Ave
- 1046 Dempsey Rd