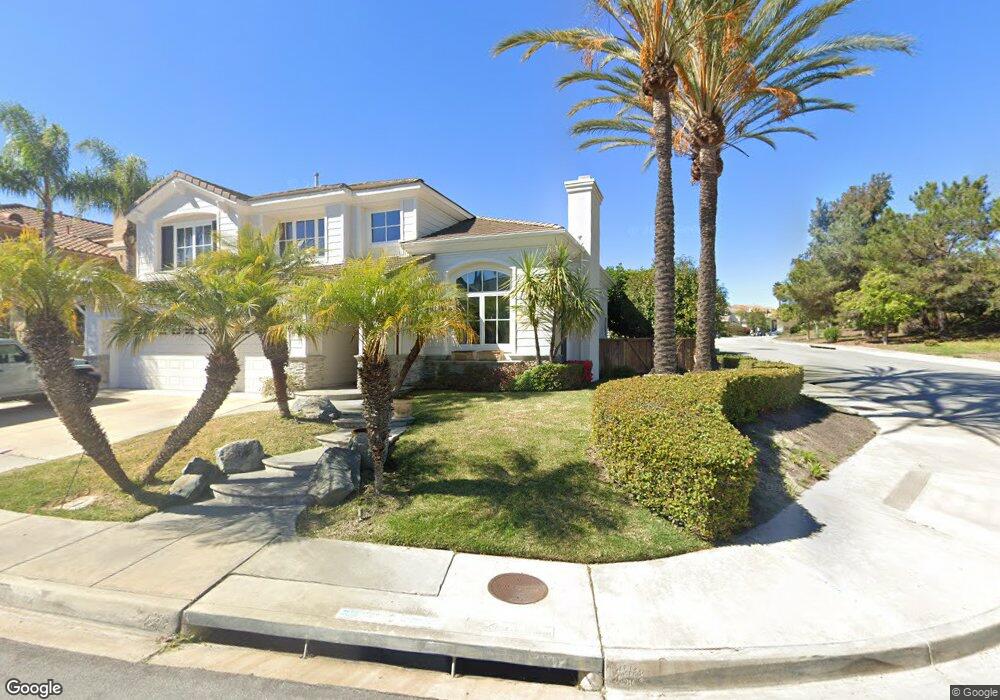
12892 Baywind Point San Diego, CA 92130
Carmel Valley NeighborhoodEstimated Value: $2,744,000 - $3,112,000
5
Beds
5
Baths
3,413
Sq Ft
$849/Sq Ft
Est. Value
About This Home
This home is located at 12892 Baywind Point, San Diego, CA 92130 and is currently estimated at $2,896,214, approximately $848 per square foot. 12892 Baywind Point is a home located in San Diego County with nearby schools including Ashley Falls Elementary School, Pacific Trails Middle, and Torrey Pines High School.
Ownership History
Date
Name
Owned For
Owner Type
Purchase Details
Closed on
Mar 7, 2014
Sold by
Maneval Daniel C and Maneval Edna Chow
Bought by
Hsieh Shin and Zhou Yingmei
Current Estimated Value
Home Financials for this Owner
Home Financials are based on the most recent Mortgage that was taken out on this home.
Original Mortgage
$400,000
Outstanding Balance
$291,642
Interest Rate
3.37%
Mortgage Type
Adjustable Rate Mortgage/ARM
Estimated Equity
$2,604,572
Purchase Details
Closed on
Aug 20, 1998
Sold by
Maneval Daniel C and Maneval Edna Chow
Bought by
Maneval Daniel C and Maneval Edna Chow
Purchase Details
Closed on
Mar 19, 1998
Sold by
Pardee Construction Company
Bought by
Maneval Daniel C and Maneval Edna Chow
Home Financials for this Owner
Home Financials are based on the most recent Mortgage that was taken out on this home.
Original Mortgage
$466,900
Interest Rate
7.06%
Create a Home Valuation Report for This Property
The Home Valuation Report is an in-depth analysis detailing your home's value as well as a comparison with similar homes in the area
Home Values in the Area
Average Home Value in this Area
Purchase History
| Date | Buyer | Sale Price | Title Company |
|---|---|---|---|
| Hsieh Shin | $1,300,000 | California Title Company | |
| Maneval Daniel C | -- | -- | |
| Maneval Daniel C | $584,000 | Chicago Title Co |
Source: Public Records
Mortgage History
| Date | Status | Borrower | Loan Amount |
|---|---|---|---|
| Open | Hsieh Shin | $400,000 | |
| Previous Owner | Maneval Daniel C | $466,900 |
Source: Public Records
Tax History Compared to Growth
Tax History
| Year | Tax Paid | Tax Assessment Tax Assessment Total Assessment is a certain percentage of the fair market value that is determined by local assessors to be the total taxable value of land and additions on the property. | Land | Improvement |
|---|---|---|---|---|
| 2025 | $17,951 | $1,593,613 | $980,685 | $612,928 |
| 2024 | $17,951 | $1,562,366 | $961,456 | $600,910 |
| 2023 | $17,747 | $1,531,732 | $942,604 | $589,128 |
| 2022 | $17,466 | $1,501,699 | $924,122 | $577,577 |
| 2021 | $16,873 | $1,472,254 | $906,002 | $566,252 |
| 2020 | $17,009 | $1,457,159 | $896,713 | $560,446 |
| 2019 | $16,702 | $1,428,588 | $879,131 | $549,457 |
| 2018 | $16,025 | $1,400,578 | $861,894 | $538,684 |
| 2017 | $15,748 | $1,373,117 | $844,995 | $528,122 |
| 2016 | $15,278 | $1,346,194 | $828,427 | $517,767 |
| 2015 | $15,083 | $1,325,974 | $815,984 | $509,990 |
| 2014 | $9,498 | $786,629 | $247,478 | $539,151 |
Source: Public Records
Map
Nearby Homes
- 4970 Beauchamp Ct
- 12722 Sandy Crest Ct
- 4919 Concannon Ct
- 5091 Ruette de Mer
- 13120 Chambord Way
- 5480 Valerio Trail
- 5582 Valerio Trail
- 4436 Heritage Glen Ln
- 12436 Cavallo St
- 13625 Winstanley Way
- 5171 Del Mar Mesa Rd
- 4271 Corte Favor
- 5621 Shasta Daisy Trail
- 0 Grand Del Mar Place Unit VU 8-4-5 NDP2502279
- 5312 Sweetwater Trail
- 12370 Carmel Country Rd Unit 202
- 12372 Carmel Country Rd Unit 207
- 12372 Carmel Country Rd Unit 202
- 12936 Carmel Creek Rd Unit 63
- 5255 Greenwillow Ln
- 12884 Baywind Point
- 5183 Pearlman Way
- 12876 Baywind Point
- 12887 Baywind Point
- 5175 Pearlman Way
- 12893 Baywind Point
- 12881 Baywind Point
- 5199 Seashell Place
- 12868 Baywind Point
- 12875 Baywind Point
- 5185 Seashell Place
- 5198 Seashell Place
- 5163 Pearlman Way
- 12860 Baywind Point
- 12869 Baywind Point
- 5171 Seashell Place
- 5142 Pearlman Way
- 5151 Pearlman Way
- 5188 Seashell Place
- 12852 Baywind Point