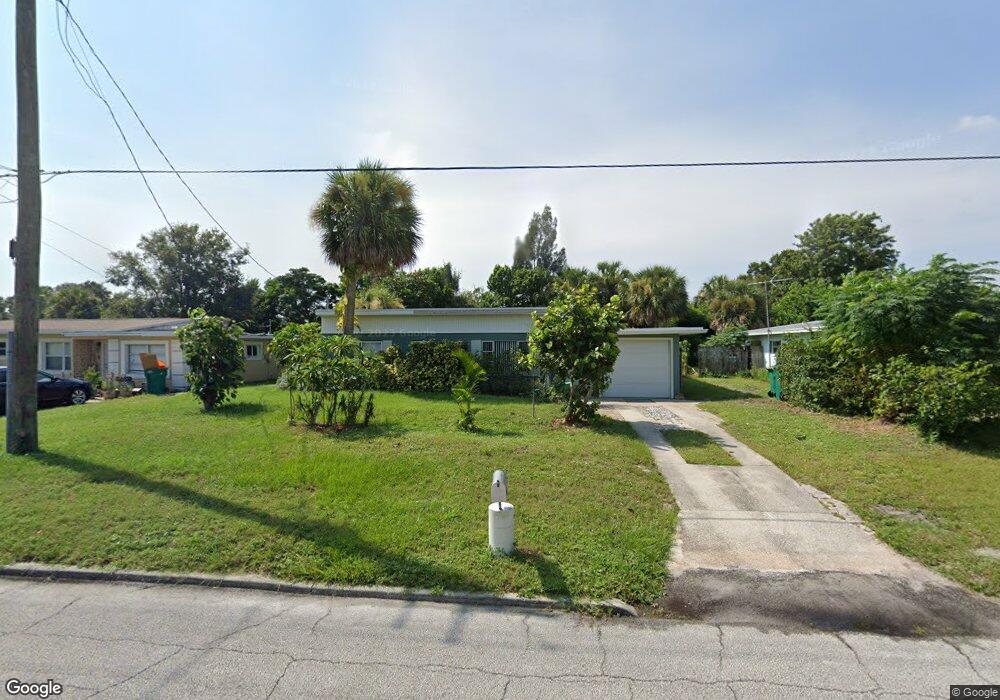
129 Cherry St Melbourne, FL 32901
Estimated Value: $171,000 - $200,000
3
Beds
1
Bath
1,026
Sq Ft
$183/Sq Ft
Est. Value
About This Home
This home is located at 129 Cherry St, Melbourne, FL 32901 and is currently estimated at $187,587, approximately $182 per square foot. 129 Cherry St is a home located in Brevard County with nearby schools including Harbor City Elementary School, Herbert C. Hoover Middle School, and Melbourne Senior High School.
Ownership History
Date
Name
Owned For
Owner Type
Purchase Details
Closed on
May 12, 2008
Sold by
Emc Mortgage Corp
Bought by
Hopps Fernery Llc
Current Estimated Value
Purchase Details
Closed on
Feb 20, 2008
Sold by
Jonakin William L
Bought by
Emc Mortgage Corp
Purchase Details
Closed on
Sep 26, 2006
Sold by
Hopkins Scott
Bought by
Jonakin William L
Home Financials for this Owner
Home Financials are based on the most recent Mortgage that was taken out on this home.
Original Mortgage
$108,800
Interest Rate
8.12%
Purchase Details
Closed on
Mar 31, 2005
Sold by
Safranski Stanley A and Safranski Stanely A
Bought by
Hopkins Scott
Home Financials for this Owner
Home Financials are based on the most recent Mortgage that was taken out on this home.
Original Mortgage
$106,331
Interest Rate
5.62%
Create a Home Valuation Report for This Property
The Home Valuation Report is an in-depth analysis detailing your home's value as well as a comparison with similar homes in the area
Home Values in the Area
Average Home Value in this Area
Purchase History
| Date | Buyer | Sale Price | Title Company |
|---|---|---|---|
| Hopps Fernery Llc | $62,000 | Attorney | |
| Emc Mortgage Corp | -- | Attorney | |
| Jonakin William L | $136,000 | Security First Title Partner | |
| Hopkins Scott | $108,000 | Security First Title Partner |
Source: Public Records
Mortgage History
| Date | Status | Borrower | Loan Amount |
|---|---|---|---|
| Previous Owner | Jonakin William L | $108,800 | |
| Previous Owner | Hopkins Scott | $106,331 |
Source: Public Records
Tax History
| Year | Tax Paid | Tax Assessment Tax Assessment Total Assessment is a certain percentage of the fair market value that is determined by local assessors to be the total taxable value of land and additions on the property. | Land | Improvement |
|---|---|---|---|---|
| 2025 | $2,047 | $141,240 | -- | -- |
| 2024 | $1,927 | $138,740 | -- | -- |
| 2023 | $1,927 | $131,930 | $0 | $0 |
| 2022 | $1,633 | $108,860 | $0 | $0 |
| 2021 | $1,421 | $74,480 | $40,000 | $34,480 |
| 2020 | $1,347 | $74,130 | $40,000 | $34,130 |
| 2019 | $1,332 | $76,500 | $40,000 | $36,500 |
| 2018 | $1,266 | $72,840 | $35,000 | $37,840 |
| 2017 | $1,121 | $55,490 | $25,000 | $30,490 |
| 2016 | $1,044 | $45,170 | $15,000 | $30,170 |
| 2015 | $1,006 | $42,140 | $15,000 | $27,140 |
| 2014 | $947 | $39,640 | $15,000 | $24,640 |
Source: Public Records
Map
Nearby Homes
- 128 Lagoon Ave
- 604 Wisteria Dr
- 115 Primrose Ln
- 110 Lagoon Ave
- 514 Hickory St
- 103 E Avenue A
- 15 E Avenue A
- 21 Branch St
- 50 Elton St
- 100 Charles Dr
- 19 Ella St Unit D
- 23 Elton St Unit 23
- 25 Elton St Unit 25
- 200 Circle Ave
- 1116 Salem Rd Unit D111
- 1131 Sleepy Hollow Rd Unit D100
- 14 W Alma Dr
- 1163 Paul Bryce Dr Unit D048
- 540 Dover Rd Unit D059
- 544 Dover Rd
- 125 Cherry St
- 133 Cherry St
- 121 Cherry St
- 130 Honeysuckle Ln
- 137 Cherry St
- 124 Honeysuckle Ln
- 134 Honeysuckle Ln
- 512 Camellia Dr
- 120 Honeysuckle Ln
- 502 Camellia Dr
- 136 Honeysuckle Ln
- 119 Cherry St
- 468 Crescent Dr
- 472 Crescent Dr
- 464 Crescent Dr
- 118 Honeysuckle Ln
- 117 Cherry St
- 460 Crescent Dr
- 517 Camellia Dr
- 116 Honeysuckle Ln
Your Personal Tour Guide
Ask me questions while you tour the home.