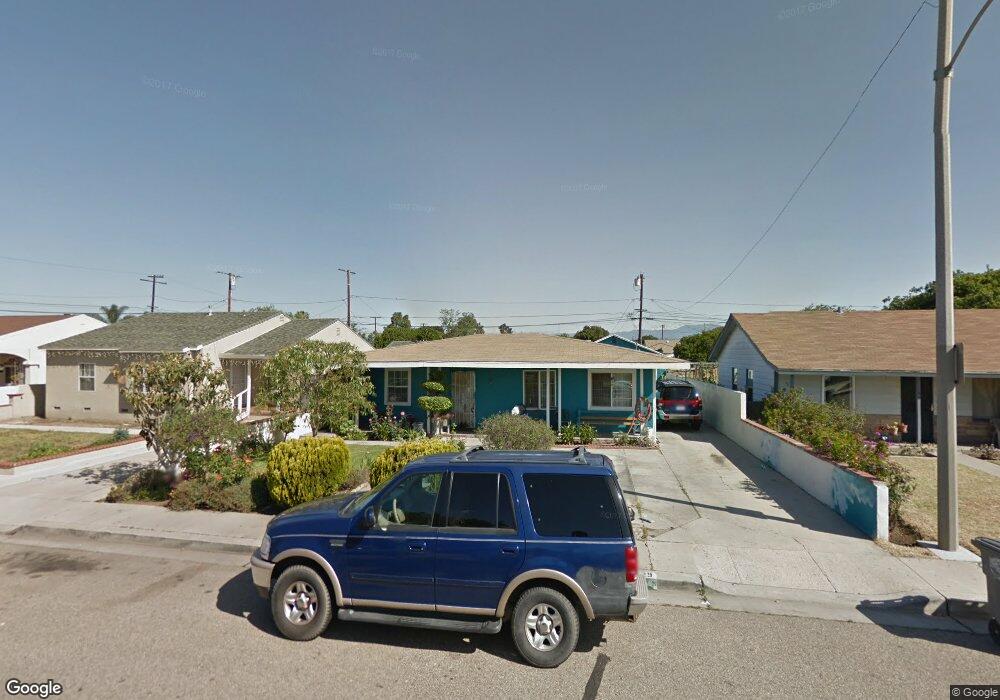
129 E Date St Oxnard, CA 93033
Cal-Gisler NeighborhoodEstimated Value: $588,000 - $676,459
3
Beds
1
Bath
936
Sq Ft
$685/Sq Ft
Est. Value
About This Home
This home is located at 129 E Date St, Oxnard, CA 93033 and is currently estimated at $640,865, approximately $684 per square foot. 129 E Date St is a home located in Ventura County with nearby schools including Elm Street Elementary School, R.J. Frank Academy of Marine Science & Engineering, and Santa Clara High School.
Ownership History
Date
Name
Owned For
Owner Type
Purchase Details
Closed on
Sep 22, 2004
Sold by
Lopez Juan C and Lopez Silvia
Bought by
Becerra Maria L and Juarez Jaime
Current Estimated Value
Home Financials for this Owner
Home Financials are based on the most recent Mortgage that was taken out on this home.
Original Mortgage
$348,000
Outstanding Balance
$179,379
Interest Rate
6.49%
Mortgage Type
Purchase Money Mortgage
Estimated Equity
$461,486
Purchase Details
Closed on
Aug 23, 1995
Sold by
Ahumada Jose Luis and Ahumada Maria G
Bought by
Ahumada Jose Luis and Ahumada Maria G
Create a Home Valuation Report for This Property
The Home Valuation Report is an in-depth analysis detailing your home's value as well as a comparison with similar homes in the area
Home Values in the Area
Average Home Value in this Area
Purchase History
| Date | Buyer | Sale Price | Title Company |
|---|---|---|---|
| Becerra Maria L | $435,000 | Chicago Title Co | |
| Lopez Juan C | $217,500 | Chicago Title Co | |
| Ahumada Jose Luis | -- | -- |
Source: Public Records
Mortgage History
| Date | Status | Borrower | Loan Amount |
|---|---|---|---|
| Open | Becerra Maria L | $348,000 | |
| Closed | Becerra Maria L | $87,000 |
Source: Public Records
Tax History
| Year | Tax Paid | Tax Assessment Tax Assessment Total Assessment is a certain percentage of the fair market value that is determined by local assessors to be the total taxable value of land and additions on the property. | Land | Improvement |
|---|---|---|---|---|
| 2025 | $7,273 | $606,336 | $508,770 | $97,566 |
| 2024 | $7,273 | $594,448 | $498,795 | $95,653 |
| 2023 | $6,187 | $515,000 | $335,000 | $180,000 |
| 2022 | $6,299 | $530,000 | $345,000 | $185,000 |
| 2021 | $5,201 | $433,000 | $358,000 | $75,000 |
| 2020 | $5,165 | $418,000 | $346,000 | $72,000 |
| 2019 | $4,947 | $404,000 | $334,000 | $70,000 |
| 2018 | $4,453 | $362,000 | $299,000 | $63,000 |
| 2017 | $4,215 | $354,000 | $292,000 | $62,000 |
| 2016 | $3,829 | $327,000 | $270,000 | $57,000 |
| 2015 | $3,504 | $292,000 | $241,000 | $51,000 |
| 2014 | $2,984 | $247,000 | $204,000 | $43,000 |
Source: Public Records
Map
Nearby Homes
- 225 W Iris St
- 1239 S C St
- 1127 S C St
- 2024 S J St
- 865 S B St Unit Q1
- 819 S B St Unit 34
- 633 Meta St
- 1030 Ilena St
- 3151 Fournier St
- 603 S G St
- 2151 E Wooley Rd
- 550 S G St
- 3130 Paula St
- 807 Kingfisher Way
- 1174 Oyster Place Unit 15
- 1501 Pisco Ln
- 1431 Casa San Carlos Ln Unit B
- 1231 Lost Point Ln
- 1309 Nautical Way
- 257 E Garden Green
Your Personal Tour Guide
Ask me questions while you tour the home.