129 E Ller Lansing, MI 48911
Southern Lansing NeighborhoodEstimated Value: $117,000 - $160,168
3
Beds
1
Bath
1,012
Sq Ft
$142/Sq Ft
Est. Value
About This Home
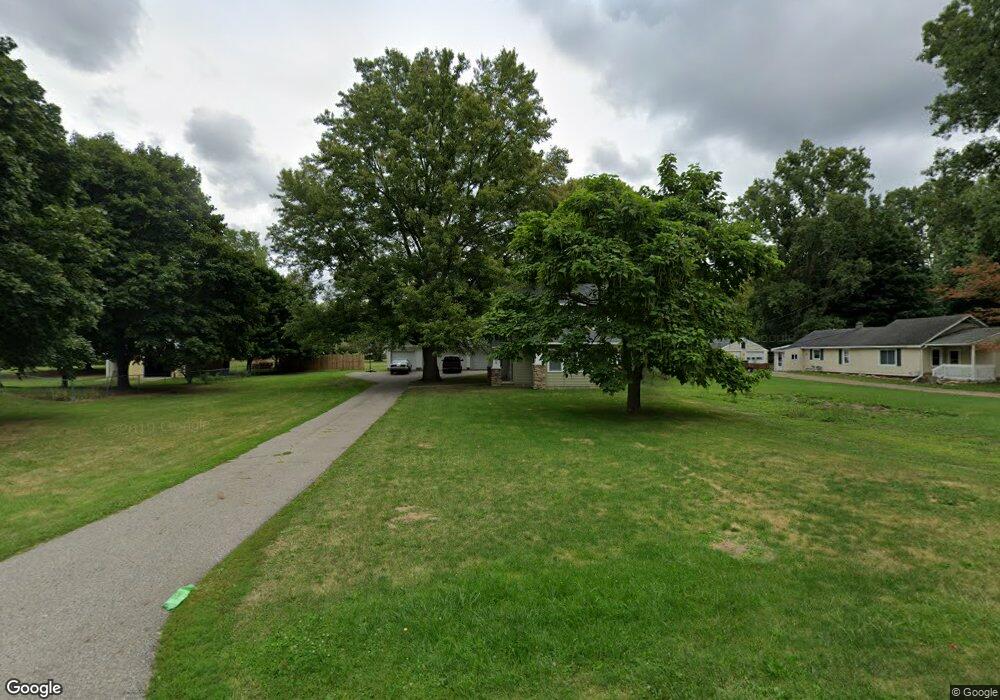
This home is located at 129 E Ller, Lansing, MI 48911 and is currently estimated at $143,792, approximately $142 per square foot. 129 E Ller is a home located in Ingham County with nearby schools including North Elementary School, Everett High School, and Immaculate Heart of Mary/St Casimir School.
Ownership History
Date
Name
Owned For
Owner Type
Purchase Details
Closed on
Dec 7, 2017
Sold by
Hansen Jared A
Bought by
Tijana Kaletovic Damir and Tijana Kaletovic
Current Estimated Value
Purchase Details
Closed on
Jul 2, 2009
Sold by
Spitz Joseph and Spitz Brandy
Bought by
Us Bank National Association
Purchase Details
Closed on
Apr 4, 2006
Sold by
Anderson Patricia M
Bought by
Spitz Joseph and Spitz Brandy
Home Financials for this Owner
Home Financials are based on the most recent Mortgage that was taken out on this home.
Original Mortgage
$90,320
Interest Rate
9.75%
Mortgage Type
Purchase Money Mortgage
Purchase Details
Closed on
Mar 13, 2003
Sold by
Bradshaw James D and Bradshaw Casey
Bought by
Anderson Patricia M
Home Financials for this Owner
Home Financials are based on the most recent Mortgage that was taken out on this home.
Original Mortgage
$77,200
Interest Rate
5.76%
Purchase Details
Closed on
Nov 22, 1996
Sold by
George John E and Diane D
Bought by
Bradshaw James D and Bradshaw Casey
Create a Home Valuation Report for This Property
The Home Valuation Report is an in-depth analysis detailing your home's value as well as a comparison with similar homes in the area
Home Values in the Area
Average Home Value in this Area
Purchase History
| Date | Buyer | Sale Price | Title Company |
|---|---|---|---|
| Tijana Kaletovic Damir | $55,000 | None Available | |
| Us Bank National Association | $100,720 | None Available | |
| Spitz Joseph | $112,900 | Fatic | |
| Anderson Patricia M | $96,500 | Fatic | |
| Bradshaw James D | $65,000 | -- |
Source: Public Records
Mortgage History
| Date | Status | Borrower | Loan Amount |
|---|---|---|---|
| Previous Owner | Spitz Joseph | $90,320 | |
| Previous Owner | Anderson Patricia M | $77,200 |
Source: Public Records
Tax History
| Year | Tax Paid | Tax Assessment Tax Assessment Total Assessment is a certain percentage of the fair market value that is determined by local assessors to be the total taxable value of land and additions on the property. | Land | Improvement |
|---|---|---|---|---|
| 2025 | $2,990 | $75,500 | $11,400 | $64,100 |
| 2024 | $24 | $63,900 | $11,400 | $52,500 |
| 2023 | $2,803 | $58,000 | $11,400 | $46,600 |
| 2022 | $2,527 | $52,500 | $11,400 | $41,100 |
| 2021 | $2,475 | $50,100 | $9,600 | $40,500 |
| 2020 | $2,460 | $46,800 | $9,600 | $37,200 |
| 2019 | $2,358 | $42,700 | $9,600 | $33,100 |
| 2018 | $2,210 | $37,900 | $9,600 | $28,300 |
| 2017 | $2,642 | $37,900 | $9,600 | $28,300 |
| 2016 | $1,952 | $35,400 | $9,600 | $25,800 |
| 2015 | $1,952 | $34,500 | $19,186 | $15,314 |
| 2014 | $1,952 | $34,500 | $23,754 | $10,746 |
Source: Public Records
Map
Nearby Homes
- 115 E Claremore Dr
- 6246 Gardenia Ave
- 6429 Rosedale Rd
- 208 E Northrup St
- 6444 Sommerset Rd
- 6421 S Washington Ave
- 826 R G Curtiss Ave
- 5267 Crocus Ave
- 1020 R G Curtiss Ave
- 1015 Brad St
- 6935 Vernson Dr
- 205 E Jolly Rd Unit 6
- 6264 Beechfield Dr Unit 97
- 419 W Jolly Rd
- 6300 Beechfield Dr Unit 87
- 6235 Yunker St
- 6817 S Washington Ave
- 5641 Ashley Dr
- 6317 Beechfield Dr Unit 49
- 5009 Kessler Dr
- 129 E Miller Rd
- 209 E Miller Rd
- 115 E Miller Rd
- 6025 Laporte Dr
- 219 E Miller Rd
- 6030 Laporte Dr
- 101 E Ller
- 6017 Laporte Dr
- 101 E Miller Rd
- 6022 Laporte Dr
- 200 E Miller Rd
- 124 E Miller Rd
- 220 E Miller Rd
- 110 E Miller Rd
- 118 E Miller Rd
- 6009 Laporte Dr
- 6025 Coulson Ct
- 6014 Laporte Dr
- 0 Coulson Ct
- 0 E Miller Rd
Your Personal Tour Guide
Ask me questions while you tour the home.