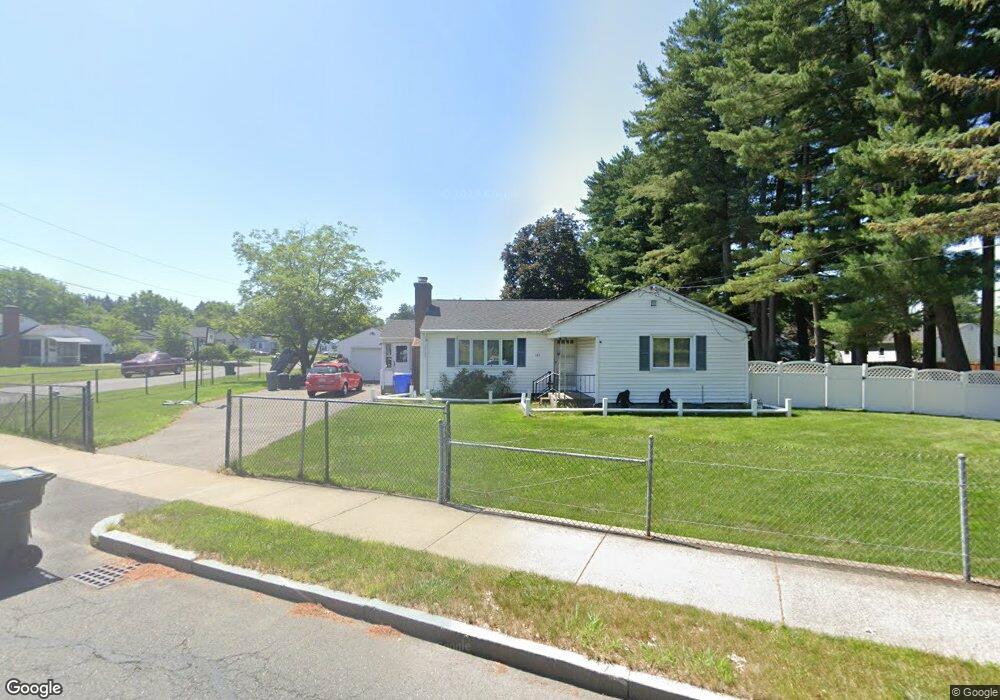
129 Fernbank Rd Springfield, MA 01129
Boston Road NeighborhoodEstimated Value: $302,595 - $333,000
3
Beds
1
Bath
1,116
Sq Ft
$284/Sq Ft
Est. Value
About This Home
This home is located at 129 Fernbank Rd, Springfield, MA 01129 and is currently estimated at $316,399, approximately $283 per square foot. 129 Fernbank Rd is a home located in Hampden County with nearby schools including Warner, M Marcus Kiley Middle, and Springfield Central High School.
Ownership History
Date
Name
Owned For
Owner Type
Purchase Details
Closed on
Jul 17, 2017
Sold by
Preston Robert L
Bought by
Preston Robert L and Preston Matthew R
Current Estimated Value
Purchase Details
Closed on
Nov 25, 2008
Sold by
Pyrek Stella
Bought by
Preston Robert L
Home Financials for this Owner
Home Financials are based on the most recent Mortgage that was taken out on this home.
Original Mortgage
$95,000
Interest Rate
6.03%
Mortgage Type
Purchase Money Mortgage
Create a Home Valuation Report for This Property
The Home Valuation Report is an in-depth analysis detailing your home's value as well as a comparison with similar homes in the area
Home Values in the Area
Average Home Value in this Area
Purchase History
| Date | Buyer | Sale Price | Title Company |
|---|---|---|---|
| Preston Robert L | -- | -- | |
| Preston Robert L | $159,000 | -- |
Source: Public Records
Mortgage History
| Date | Status | Borrower | Loan Amount |
|---|---|---|---|
| Previous Owner | Preston Robert L | $95,000 |
Source: Public Records
Tax History Compared to Growth
Tax History
| Year | Tax Paid | Tax Assessment Tax Assessment Total Assessment is a certain percentage of the fair market value that is determined by local assessors to be the total taxable value of land and additions on the property. | Land | Improvement |
|---|---|---|---|---|
| 2025 | $3,838 | $244,800 | $59,600 | $185,200 |
| 2024 | $3,798 | $236,500 | $59,600 | $176,900 |
| 2023 | $3,654 | $214,300 | $56,700 | $157,600 |
| 2022 | $3,521 | $187,100 | $56,700 | $130,400 |
| 2021 | $3,298 | $174,500 | $51,500 | $123,000 |
| 2020 | $3,123 | $159,900 | $51,500 | $108,400 |
| 2019 | $2,873 | $146,000 | $51,500 | $94,500 |
| 2018 | $2,946 | $149,700 | $51,500 | $98,200 |
| 2017 | $2,786 | $141,700 | $46,500 | $95,200 |
| 2016 | $2,805 | $142,700 | $46,500 | $96,200 |
| 2015 | $2,549 | $129,600 | $46,500 | $83,100 |
Source: Public Records
Map
Nearby Homes