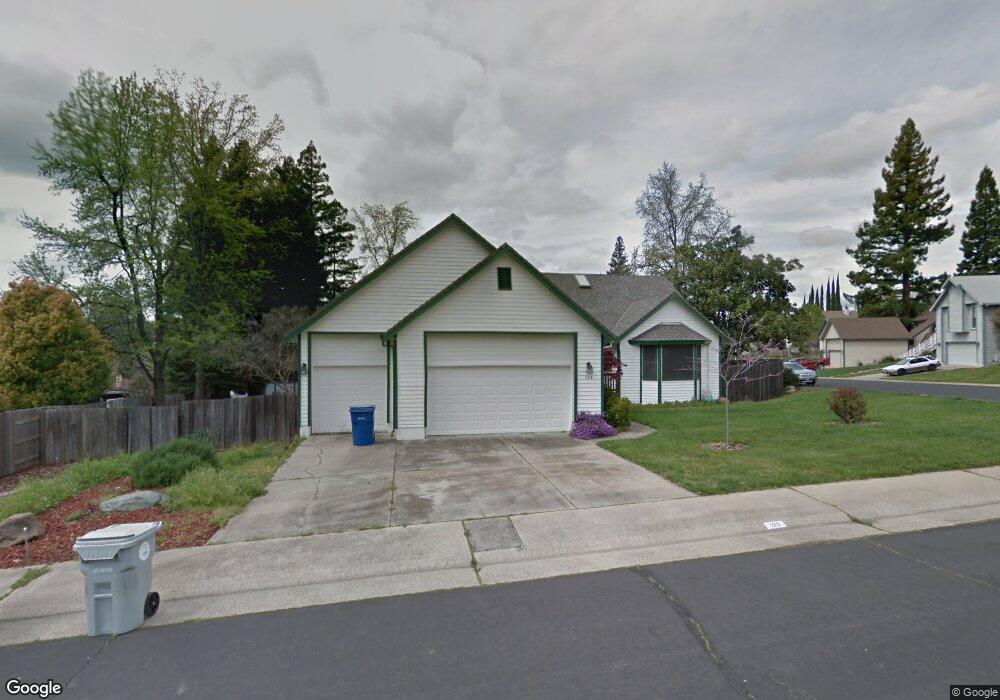
129 Windstar Cir Folsom, CA 95630
Briggs Ranch NeighborhoodEstimated Value: $769,000 - $867,000
5
Beds
2
Baths
2,261
Sq Ft
$369/Sq Ft
Est. Value
About This Home
This home is located at 129 Windstar Cir, Folsom, CA 95630 and is currently estimated at $834,790, approximately $369 per square foot. 129 Windstar Cir is a home located in Sacramento County with nearby schools including Folsom Hills Elementary School, Folsom Middle School, and Vista Del Lago High School.
Ownership History
Date
Name
Owned For
Owner Type
Purchase Details
Closed on
Jun 26, 2015
Sold by
Gross Garth and Gross Erin
Bought by
The Garth & Erin Gross Living Trust
Current Estimated Value
Purchase Details
Closed on
Mar 12, 2015
Sold by
Gross Garth and Gross Erin
Bought by
Gross Garth and Gross Erin
Purchase Details
Closed on
Oct 11, 2011
Sold by
Leger Virginia M and The Family Trust Of Paul R Leg
Bought by
Gross Garth and Gross Erin
Home Financials for this Owner
Home Financials are based on the most recent Mortgage that was taken out on this home.
Original Mortgage
$288,000
Outstanding Balance
$196,900
Interest Rate
4.15%
Mortgage Type
New Conventional
Estimated Equity
$637,890
Purchase Details
Closed on
Jan 19, 2004
Sold by
Leger Paul R and Leger Virginia M
Bought by
Leger Paul R and Leger Virginia M
Create a Home Valuation Report for This Property
The Home Valuation Report is an in-depth analysis detailing your home's value as well as a comparison with similar homes in the area
Home Values in the Area
Average Home Value in this Area
Purchase History
| Date | Buyer | Sale Price | Title Company |
|---|---|---|---|
| The Garth & Erin Gross Living Trust | -- | None Available | |
| Gross Garth | -- | None Available | |
| Gross Garth | $320,000 | Fidelity National Title Co | |
| Leger Paul R | -- | -- |
Source: Public Records
Mortgage History
| Date | Status | Borrower | Loan Amount |
|---|---|---|---|
| Open | Gross Garth | $288,000 |
Source: Public Records
Tax History
| Year | Tax Paid | Tax Assessment Tax Assessment Total Assessment is a certain percentage of the fair market value that is determined by local assessors to be the total taxable value of land and additions on the property. | Land | Improvement |
|---|---|---|---|---|
| 2025 | $4,217 | $401,925 | $172,700 | $229,225 |
| 2024 | $4,217 | $394,045 | $169,314 | $224,731 |
| 2023 | $4,141 | $386,320 | $165,995 | $220,325 |
| 2022 | $4,079 | $378,746 | $162,741 | $216,005 |
| 2021 | $4,024 | $371,320 | $159,550 | $211,770 |
| 2020 | $3,973 | $367,514 | $157,915 | $209,599 |
| 2019 | $3,905 | $360,309 | $154,819 | $205,490 |
| 2018 | $3,807 | $353,245 | $151,784 | $201,461 |
| 2017 | $3,549 | $346,319 | $148,808 | $197,511 |
| 2016 | $3,707 | $339,530 | $145,891 | $193,639 |
| 2015 | $3,581 | $334,431 | $143,700 | $190,731 |
| 2014 | $3,398 | $327,881 | $140,886 | $186,995 |
Source: Public Records
Map
Nearby Homes
- 147 Rebecca Way
- 104 Whelan Ct
- 100 Boxler Ct
- 103 Econome Ct
- 113 Rebecca Way
- 129 Cerrito Dr
- 103 Rebecca Way
- 430 Flower Dr
- 609 Willow Creek Dr
- 109 Lions Way
- 155 Bittercreek Dr
- 194 Briggs Ranch Dr
- 149 Winterstein Dr
- 136 Rambling Dr
- 100 Hensey Ct
- 1380 Quigley Ct
- 198 Big Valley Rd
- 1437 Cummings Way
- 141 Sierra Woods Cir
- 136 Penaranda Dr
- 296 Randall Dr
- 121 Windstar Cir
- 292 Randall Dr
- 134 Windstar Cir
- 299 Randall Dr
- 288 Randall Dr
- 117 Windstar Cir
- 109 Windstar Cir
- 295 Randall Dr
- 126 Windstar Cir
- 128 Windstar Cir
- 130 Windstar Cir
- 284 Randall Dr
- 105 Windstar Cir
- 132 Windstar Cir
- 291 Randall Dr
- 113 Windstar Cir
- 122 Windstar Cir
- 303 Randall Dr
- 280 Randall Dr
Your Personal Tour Guide
Ask me questions while you tour the home.