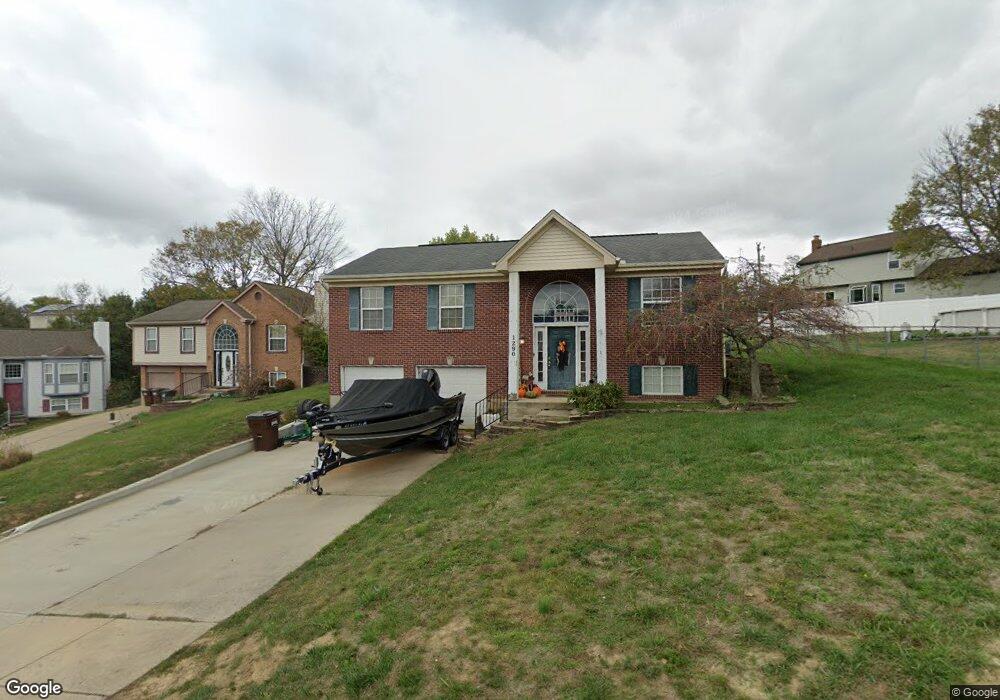
1290 Trenton Ct Independence, KY 41051
Estimated Value: $252,000 - $266,314
3
Beds
3
Baths
1,134
Sq Ft
$230/Sq Ft
Est. Value
About This Home
This home is located at 1290 Trenton Ct, Independence, KY 41051 and is currently estimated at $261,079, approximately $230 per square foot. 1290 Trenton Ct is a home located in Kenton County with nearby schools including Beechgrove Elementary School, Simon Kenton High School, and St. Cecilia Catholic School.
Ownership History
Date
Name
Owned For
Owner Type
Purchase Details
Closed on
Oct 31, 2008
Sold by
Secretary Of Housing & Urban Development
Bought by
Finn Kyle James
Current Estimated Value
Home Financials for this Owner
Home Financials are based on the most recent Mortgage that was taken out on this home.
Original Mortgage
$121,380
Outstanding Balance
$79,795
Interest Rate
6.11%
Mortgage Type
Purchase Money Mortgage
Estimated Equity
$181,284
Purchase Details
Closed on
Jul 7, 2008
Sold by
Stidham William C and Stidham Danielle L
Bought by
Hud
Purchase Details
Closed on
Sep 10, 2001
Sold by
Prospect Realty Llc
Bought by
Stidham William C Danielle L
Home Financials for this Owner
Home Financials are based on the most recent Mortgage that was taken out on this home.
Original Mortgage
$128,269
Interest Rate
7.02%
Mortgage Type
FHA
Purchase Details
Closed on
Aug 17, 1999
Sold by
Finke Homes Inc
Bought by
Prospect Realty Llc
Create a Home Valuation Report for This Property
The Home Valuation Report is an in-depth analysis detailing your home's value as well as a comparison with similar homes in the area
Home Values in the Area
Average Home Value in this Area
Purchase History
| Date | Buyer | Sale Price | Title Company |
|---|---|---|---|
| Finn Kyle James | $117,000 | Regional First Title Group | |
| Hud | $102,000 | None Available | |
| Stidham William C Danielle L | $129,845 | -- | |
| Prospect Realty Llc | $119,500 | -- |
Source: Public Records
Mortgage History
| Date | Status | Borrower | Loan Amount |
|---|---|---|---|
| Open | Finn Kyle James | $121,380 | |
| Previous Owner | Stidham William C Danielle L | $128,269 |
Source: Public Records
Tax History Compared to Growth
Tax History
| Year | Tax Paid | Tax Assessment Tax Assessment Total Assessment is a certain percentage of the fair market value that is determined by local assessors to be the total taxable value of land and additions on the property. | Land | Improvement |
|---|---|---|---|---|
| 2024 | $1,683 | $137,400 | $30,000 | $107,400 |
| 2023 | $1,734 | $137,400 | $30,000 | $107,400 |
| 2022 | $1,799 | $137,400 | $30,000 | $107,400 |
| 2021 | $1,825 | $137,400 | $30,000 | $107,400 |
| 2020 | $1,597 | $117,000 | $30,000 | $87,000 |
| 2019 | $1,601 | $117,000 | $30,000 | $87,000 |
| 2018 | $1,610 | $117,000 | $30,000 | $87,000 |
| 2017 | $1,567 | $117,000 | $30,000 | $87,000 |
| 2015 | $1,517 | $117,000 | $30,000 | $87,000 |
| 2014 | $1,496 | $117,000 | $30,000 | $87,000 |
Source: Public Records
Map
Nearby Homes
- 9831 Codyview Dr
- 1099 Amblewood Ct
- 1373 Meadowrun Ln
- 10311 Emancipation Place
- 4106 Willowview Dr
- 4102 Willowview Dr
- 4101 Willowview Dr
- 4109 Willowview Dr
- Cumberland Plan at Meadow Glen - Maple Street Collection
- Wesley Plan at Meadow Glen - Maple Street Collection
- 1133 Stonewallridge Dr
- 1253 Shiloh Ct
- 1375 Meadowcrest Cir
- 4079 Elizabeth Dr
- 10323 Manassas Ct
- 4071 Elizabeth Dr
- 4320 Cobblewood Ct
- 1355 Meadowcrest Cir
- 10340 Calvary Rd
- 1056 Oakwood Ct Unit 3
- 9876 Flagstone Dr
- 1286 Trenton Ct
- 1289 Constitution Dr
- 1293 Constitution Dr
- 1282 Trenton Ct
- 1289 Trenton Ct
- 1285 Trenton Ct
- 1285 Constitution Dr
- 9884 Flagstone Dr
- 1281 Trenton Ct
- 1281 Constitution Dr
- 9879 Liberty Ct
- 1293 Harbor Ct
- 9888 Flagstone Dr
- 9921 Cobblestone Blvd
- 9877 Flagstone Dr
- 9881 Flagstone Dr
- 9925 Cobblestone Blvd
- 1288 Constitution Dr
- 9873 Flagstone Dr