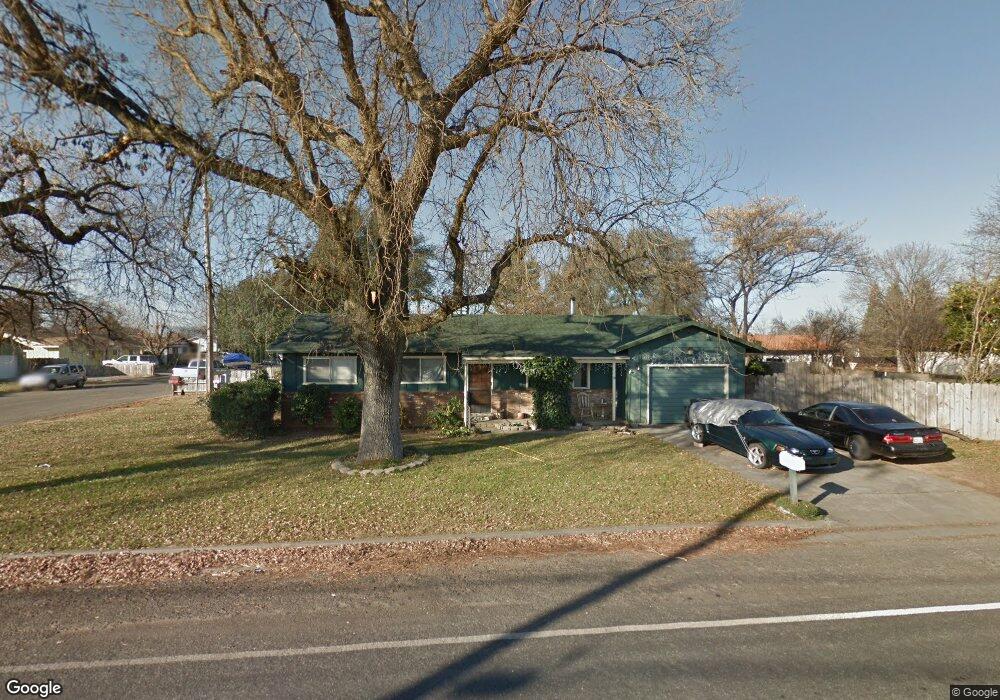
12905 Wilder Rd Red Bluff, CA 96080
Estimated Value: $243,000 - $386,000
3
Beds
2
Baths
1,296
Sq Ft
$233/Sq Ft
Est. Value
About This Home
This home is located at 12905 Wilder Rd, Red Bluff, CA 96080 and is currently estimated at $302,068, approximately $233 per square foot. 12905 Wilder Rd is a home located in Tehama County with nearby schools including Bidwell Elementary School, Vista Preparatory Academy, and Red Bluff High School.
Ownership History
Date
Name
Owned For
Owner Type
Purchase Details
Closed on
Jan 19, 2018
Sold by
Odle William Morse
Bought by
Coley Ryan and Rewerts Jessica Danielle
Current Estimated Value
Home Financials for this Owner
Home Financials are based on the most recent Mortgage that was taken out on this home.
Original Mortgage
$169,375
Outstanding Balance
$148,219
Interest Rate
5.5%
Mortgage Type
FHA
Estimated Equity
$153,849
Purchase Details
Closed on
May 3, 2007
Sold by
Odle William Morse and Odle Mary Pauline
Bought by
Odle William Morse and Odle Mary Pauline
Purchase Details
Closed on
Oct 28, 2005
Sold by
Odle William Morse and Odle Mary P
Bought by
Odle William Morse and Odle Mary P
Home Financials for this Owner
Home Financials are based on the most recent Mortgage that was taken out on this home.
Original Mortgage
$85,000
Interest Rate
5.68%
Mortgage Type
New Conventional
Create a Home Valuation Report for This Property
The Home Valuation Report is an in-depth analysis detailing your home's value as well as a comparison with similar homes in the area
Home Values in the Area
Average Home Value in this Area
Purchase History
| Date | Buyer | Sale Price | Title Company |
|---|---|---|---|
| Coley Ryan | $172,500 | Placer Title Co | |
| Odle William Morse | -- | None Available | |
| Odle William Morse | -- | Advantage Title Inc |
Source: Public Records
Mortgage History
| Date | Status | Borrower | Loan Amount |
|---|---|---|---|
| Open | Coley Ryan | $169,375 | |
| Previous Owner | Odle William Morse | $85,000 |
Source: Public Records
Tax History Compared to Growth
Tax History
| Year | Tax Paid | Tax Assessment Tax Assessment Total Assessment is a certain percentage of the fair market value that is determined by local assessors to be the total taxable value of land and additions on the property. | Land | Improvement |
|---|---|---|---|---|
| 2025 | $1,996 | $196,270 | $68,267 | $128,003 |
| 2023 | $1,963 | $188,651 | $65,617 | $123,034 |
| 2022 | $1,949 | $184,953 | $64,331 | $120,622 |
| 2021 | $1,878 | $181,327 | $63,070 | $118,257 |
| 2020 | $1,910 | $179,469 | $62,424 | $117,045 |
| 2019 | $1,922 | $175,950 | $61,200 | $114,750 |
| 2018 | $1,011 | $97,777 | $21,435 | $76,342 |
| 2017 | $1,020 | $95,861 | $21,015 | $74,846 |
| 2016 | $953 | $93,982 | $20,603 | $73,379 |
| 2015 | -- | $92,571 | $20,294 | $72,277 |
| 2014 | $924 | $90,759 | $19,897 | $70,862 |
Source: Public Records
Map
Nearby Homes
- 20481 Womack Rd
- 20360 Acorn Ave
- 2093 Stonybrook Dr
- 1865 Douglass St
- 1815 Park Ave
- 1450 Bulkeley St
- 1530 Carmel Way
- 1530 Elva Ave
- 1846 Walbridge St
- 1805 Walbridge St
- 1720 Luning St
- 1800 Walbridge St
- 1940 Gentry Way
- 1435 Garryana Dr
- 1810 Kemper Ave
- 1555 Acacia St
- 1455 Acacia St
- 1514 Walbridge St
- 1359 2nd St
- 1565 Carl Ct
- 20486 Womack Rd
- 12911 Wilder Rd
- 20482 Womack Rd
- 12875 Wilder Rd
- 20485 Womack Rd
- 20485 Womack Rd
- 20478 Womack Rd
- 20477 Womack Rd
- 12925 Wilder Rd
- 20473 Womack Rd
- 20470 Womack Rd
- 20469 Womack Rd
- 20509 Walnut St
- 20466 Womack Rd
- 12857 Wilder Rd
- 12935 Wilder Rd
- 20519 Walnut St
- 12921 Wilder Rd
- 20465 Womack Rd
- 20462 Womack Rd