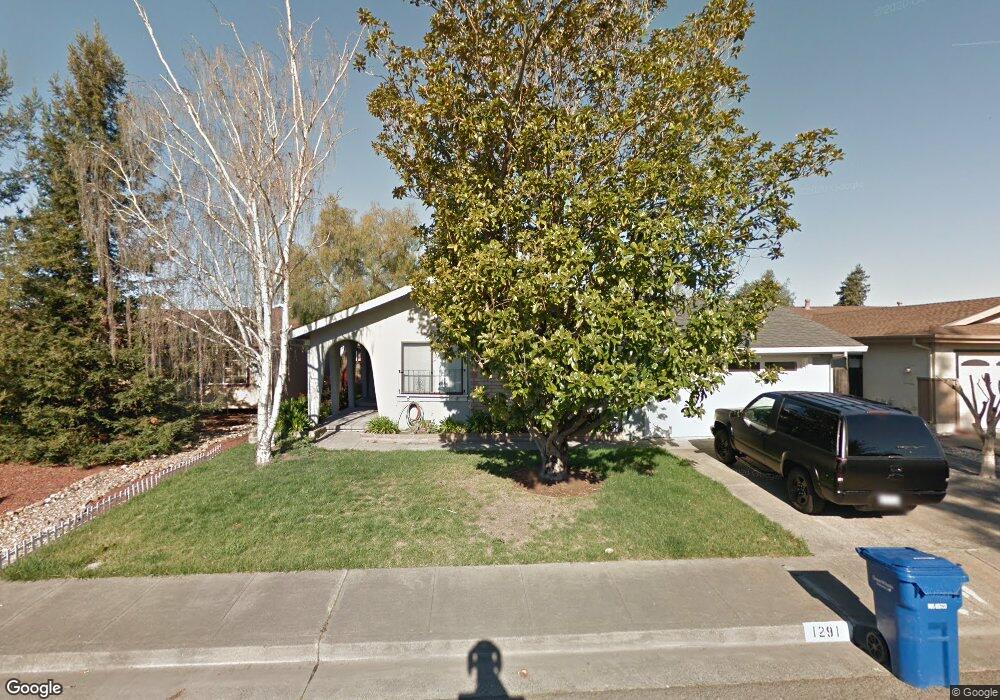
1291 Aspen Way Petaluma, CA 94954
Adobe NeighborhoodEstimated Value: $757,992 - $908,000
4
Beds
2
Baths
1,505
Sq Ft
$536/Sq Ft
Est. Value
About This Home
This home is located at 1291 Aspen Way, Petaluma, CA 94954 and is currently estimated at $807,248, approximately $536 per square foot. 1291 Aspen Way is a home located in Sonoma County with nearby schools including Kenilworth Junior High School, Casa Grande High School, and Miwok Valley Elementary Charter School.
Ownership History
Date
Name
Owned For
Owner Type
Purchase Details
Closed on
Apr 9, 2025
Sold by
Perrier 2011 Olivier F and Perri Gwvneth
Bought by
Perrier Olivier F and Perrier Gwyneth C
Current Estimated Value
Purchase Details
Closed on
May 27, 2011
Sold by
Perrier Olivier F and Perrier Gwyneth C
Bought by
Perrier Olivier F and Perrier Gwyneth C
Home Financials for this Owner
Home Financials are based on the most recent Mortgage that was taken out on this home.
Original Mortgage
$205,000
Interest Rate
4.84%
Mortgage Type
New Conventional
Purchase Details
Closed on
May 16, 2011
Sold by
Neve Corinna C
Bought by
Perrier Olivier F and Perrier Gwyneth C
Home Financials for this Owner
Home Financials are based on the most recent Mortgage that was taken out on this home.
Original Mortgage
$205,000
Interest Rate
4.84%
Mortgage Type
New Conventional
Purchase Details
Closed on
Aug 3, 2006
Sold by
Neve Corinna C and Cicuttin Corinna K
Bought by
Neve Robert J and Neve Corinna C
Home Financials for this Owner
Home Financials are based on the most recent Mortgage that was taken out on this home.
Original Mortgage
$886,500
Interest Rate
6.76%
Mortgage Type
Purchase Money Mortgage
Create a Home Valuation Report for This Property
The Home Valuation Report is an in-depth analysis detailing your home's value as well as a comparison with similar homes in the area
Home Values in the Area
Average Home Value in this Area
Purchase History
| Date | Buyer | Sale Price | Title Company |
|---|---|---|---|
| Perrier Olivier F | -- | None Listed On Document | |
| Perrier Olivier F | -- | None Available | |
| Perrier Olivier F | $303,000 | Fidelity National Title Co | |
| Neve Robert J | -- | Old Republic Title Company |
Source: Public Records
Mortgage History
| Date | Status | Borrower | Loan Amount |
|---|---|---|---|
| Previous Owner | Perrier Olivier F | $205,000 | |
| Previous Owner | Neve Robert J | $886,500 |
Source: Public Records
Tax History Compared to Growth
Tax History
| Year | Tax Paid | Tax Assessment Tax Assessment Total Assessment is a certain percentage of the fair market value that is determined by local assessors to be the total taxable value of land and additions on the property. | Land | Improvement |
|---|---|---|---|---|
| 2025 | $4,279 | $388,183 | $160,142 | $228,041 |
| 2024 | $4,279 | $380,572 | $157,002 | $223,570 |
| 2023 | $4,279 | $373,111 | $153,924 | $219,187 |
| 2022 | $4,182 | $365,796 | $150,906 | $214,890 |
| 2021 | $4,134 | $358,625 | $147,948 | $210,677 |
| 2020 | $4,163 | $354,948 | $146,431 | $208,517 |
| 2019 | $4,121 | $347,989 | $143,560 | $204,429 |
| 2018 | $4,002 | $341,167 | $140,746 | $200,421 |
| 2017 | $3,944 | $334,479 | $137,987 | $196,492 |
| 2016 | $3,820 | $327,922 | $135,282 | $192,640 |
| 2015 | $3,722 | $322,997 | $133,250 | $189,747 |
| 2014 | $3,685 | $316,671 | $130,640 | $186,031 |
Source: Public Records
Map
Nearby Homes
- 1020 Catalpa Way
- 1120 S Mcdowell Blvd
- 859 S Mcdowell Blvd
- 1821 Lakeville Hwy Unit 77
- 1052 Helen Ct
- 1293 Pacific Ave
- 844 Cedarwood Ln
- 1609 San Marino Dr
- 520 Reynolds Dr
- 1711 Capistrano Dr
- 1313 Mcgregor Ave
- 601 Marylyn Cir Unit 21
- 602 Marylyn Cir
- 1103 Marylyn Cir
- 416 Cortez Dr
- 1302 Marylyn Cir
- 221 Preston Ct
- 303 Jacquelyn Ln
- 530 Jade St
- 232 Mcnear Cir
- 1295 Aspen Way
- 1287 Aspen Way
- 1021 Carob Ct
- 1017 Carob Ct
- 1283 Aspen Way
- 1299 Aspen Way
- 1296 Aspen Way
- 1292 Aspen Way
- 1025 Carob Ct
- 1300 Aspen Way
- 1288 Aspen Way
- 1020 Palmetto Way
- 1013 Carob Ct
- 1304 Aspen Way
- 1284 Aspen Way
- 1016 Palmetto Way
- 1295 Beechwood Dr
- 1291 Beechwood Dr
- 1024 Aspen Way
- 1308 Aspen Way