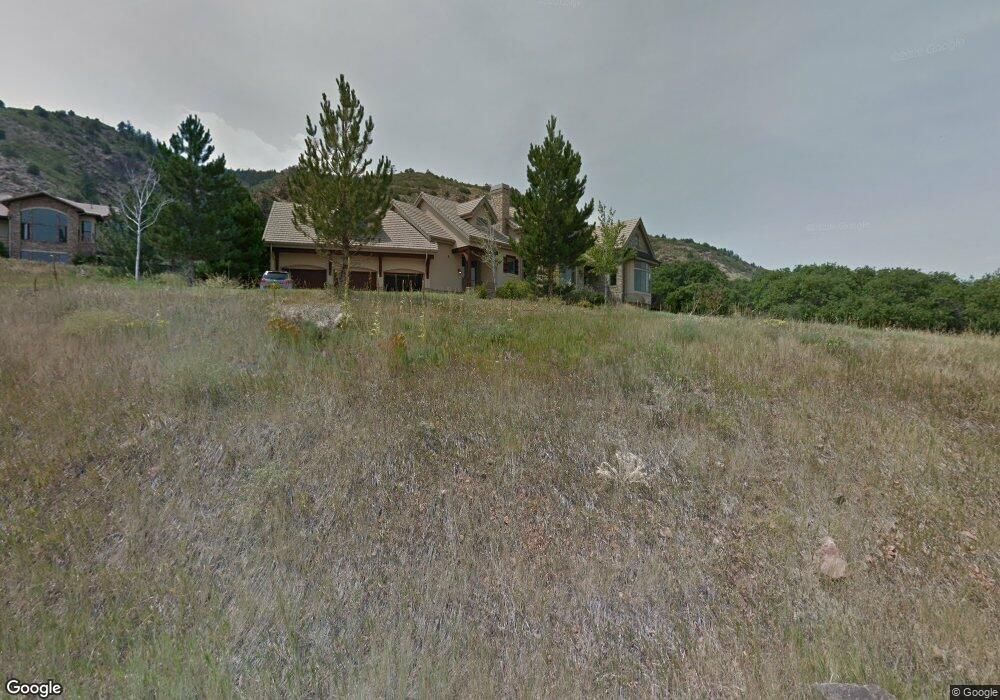
12913 Silver Elk Ln Littleton, CO 80127
Estimated Value: $2,107,000 - $2,671,000
5
Beds
6
Baths
7,528
Sq Ft
$308/Sq Ft
Est. Value
About This Home
This home is located at 12913 Silver Elk Ln, Littleton, CO 80127 and is currently estimated at $2,318,491, approximately $307 per square foot. 12913 Silver Elk Ln is a home located in Jefferson County with nearby schools including Bradford K8 South, Bradford K8 North, and Chatfield High School.
Ownership History
Date
Name
Owned For
Owner Type
Purchase Details
Closed on
Jun 20, 2012
Sold by
The Bank Of New York Mellon
Bought by
12913 Silver Elk Llc
Current Estimated Value
Purchase Details
Closed on
Aug 11, 2011
Sold by
Riley Stephanie R
Bought by
The Bank Of New York Mellon and The Bank Of New York
Purchase Details
Closed on
Mar 15, 2002
Sold by
Dc Builders Inc
Bought by
Riley Stephanie R
Home Financials for this Owner
Home Financials are based on the most recent Mortgage that was taken out on this home.
Original Mortgage
$1,000,000
Interest Rate
6.62%
Purchase Details
Closed on
Jul 7, 1999
Sold by
Tcd North Inc
Bought by
Dc Builders Inc
Purchase Details
Closed on
Apr 9, 1999
Sold by
Schoenberger Erich V and Schoenberger Eileen D
Bought by
T C D North Inc
Purchase Details
Closed on
Aug 31, 1998
Sold by
T C D North Inc
Bought by
Schoenberger Erich and Schoenberger Eileen D
Create a Home Valuation Report for This Property
The Home Valuation Report is an in-depth analysis detailing your home's value as well as a comparison with similar homes in the area
Home Values in the Area
Average Home Value in this Area
Purchase History
| Date | Buyer | Sale Price | Title Company |
|---|---|---|---|
| 12913 Silver Elk Llc | $910,000 | North American Title | |
| The Bank Of New York Mellon | -- | None Available | |
| Riley Stephanie R | $1,425,000 | -- | |
| Dc Builders Inc | $210,000 | -- | |
| T C D North Inc | $175,000 | -- | |
| Schoenberger Erich | $175,000 | North American Title Co |
Source: Public Records
Mortgage History
| Date | Status | Borrower | Loan Amount |
|---|---|---|---|
| Previous Owner | Riley Stephanie R | $1,000,000 |
Source: Public Records
Tax History Compared to Growth
Tax History
| Year | Tax Paid | Tax Assessment Tax Assessment Total Assessment is a certain percentage of the fair market value that is determined by local assessors to be the total taxable value of land and additions on the property. | Land | Improvement |
|---|---|---|---|---|
| 2024 | $11,708 | $130,680 | $53,197 | $77,483 |
| 2023 | $11,708 | $130,680 | $53,197 | $77,483 |
| 2022 | $11,082 | $121,948 | $71,596 | $50,352 |
| 2021 | $11,175 | $125,457 | $73,656 | $51,801 |
| 2020 | $8,823 | $99,311 | $49,878 | $49,433 |
| 2019 | $8,694 | $99,311 | $49,878 | $49,433 |
| 2018 | $7,949 | $87,969 | $45,425 | $42,544 |
| 2017 | $6,960 | $87,969 | $45,425 | $42,544 |
| 2016 | $8,326 | $98,213 | $38,975 | $59,238 |
| 2015 | $8,037 | $98,213 | $38,975 | $59,238 |
| 2014 | $8,037 | $88,793 | $34,355 | $54,438 |
Source: Public Records
Map
Nearby Homes
- 9737 Elkhorn St
- 12312 White Deer Dr
- 9356 Cherrywood Trail
- 12947 Lazy Dog Ln
- 0 Sampson Rd Unit REC8790688
- 15941 W Sampson Rd
- 9836 W Freiburg Dr Unit 4B
- 9921 W Edenburg Place
- 9876 W Freiburg Dr Unit F
- 0 W Sampson Rd Unit 9064379
- 9788 S Johnson Way
- 9896 W Freiburg Dr Unit 1B
- 9896 W Freiburg Dr Unit 1D
- 9796 W Freiburg Dr Unit H
- 10230 S Deer Creek Rd
- 9407 W Gibraltar Place
- 11696 Trappers Mountain Trail
- 10062 W Victoria Place Unit 205
- 10061 W Victoria Place Unit 204
- 9992 W Victoria Place Unit 103
- 12933 Silver Elk Ln
- 9957 Elkhorn St
- 12963 Silver Elk Ln
- 9946 Elkhorn St
- 9916 Elkhorn St
- 9907 Elkhorn St
- 13091 Brown Bear Trail
- 12944 Silver Elk Ln
- 12964 Silver Elk Ln
- 9786 Elkhorn St
- 13081 Brown Bear Trail
- 13081 Brown Bear Trail
- 9787 Elkhorn St
- 9966 Elkhorn St
- 13096 Twin Elk Ln
- 9792 Elkhorn St
- 9776 Elkhorn St
- 9986 Elkhorn St
- 12531 White Deer Dr
- 13056 Twin Elk Ln