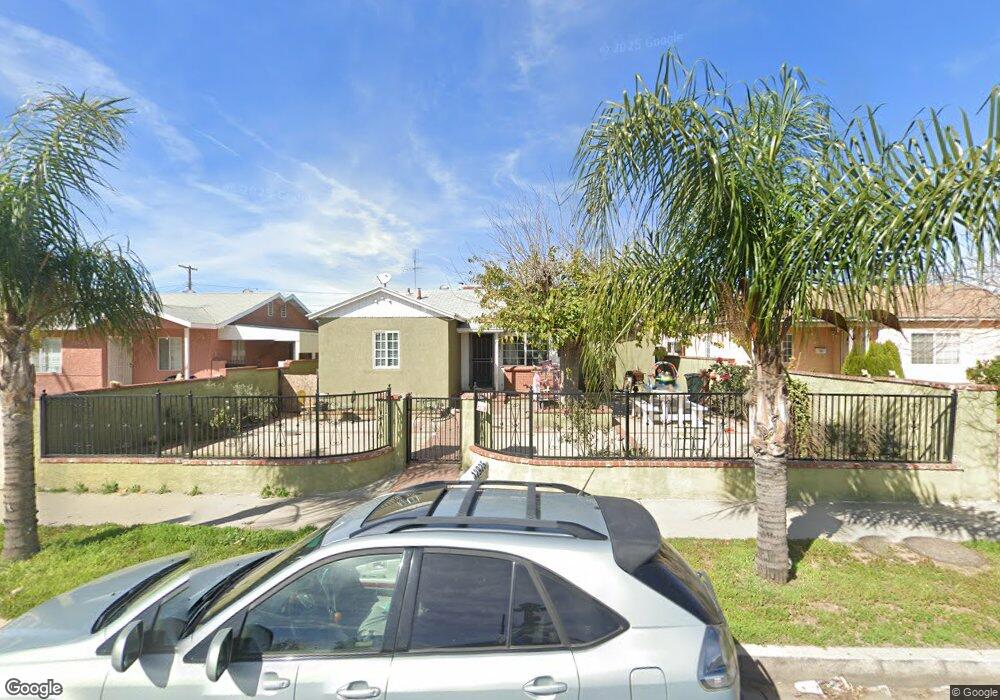
12925 Osborne St Pacoima, CA 91331
Estimated Value: $681,000 - $804,000
2
Beds
1
Bath
1,387
Sq Ft
$538/Sq Ft
Est. Value
About This Home
This home is located at 12925 Osborne St, Pacoima, CA 91331 and is currently estimated at $746,003, approximately $537 per square foot. 12925 Osborne St is a home located in Los Angeles County with nearby schools including Pacoima Middle School, San Fernando Senior High School, and Montague Charter Academy.
Ownership History
Date
Name
Owned For
Owner Type
Purchase Details
Closed on
Mar 17, 2003
Sold by
Flores Arnoldo
Bought by
Flores Arnoldo
Current Estimated Value
Home Financials for this Owner
Home Financials are based on the most recent Mortgage that was taken out on this home.
Original Mortgage
$157,050
Outstanding Balance
$66,726
Interest Rate
5.72%
Estimated Equity
$679,277
Purchase Details
Closed on
Dec 28, 1998
Sold by
Federal Home Loan Mortgage Corporation
Bought by
Flores Arnoldo and Solis Luz M
Home Financials for this Owner
Home Financials are based on the most recent Mortgage that was taken out on this home.
Original Mortgage
$104,742
Interest Rate
6.82%
Mortgage Type
FHA
Purchase Details
Closed on
Sep 15, 1998
Sold by
Norwest Mtg Inc
Bought by
Federal Home Loan Mortgage Corporation
Create a Home Valuation Report for This Property
The Home Valuation Report is an in-depth analysis detailing your home's value as well as a comparison with similar homes in the area
Home Values in the Area
Average Home Value in this Area
Purchase History
| Date | Buyer | Sale Price | Title Company |
|---|---|---|---|
| Flores Arnoldo | -- | Stewart Title | |
| Flores Arnoldo | $105,500 | Chicago Title Co | |
| Federal Home Loan Mortgage Corporation | -- | Benefit Land Title Ins Co | |
| Norwest Mtg Inc | $128,000 | Benefit Land Title Ins Co |
Source: Public Records
Mortgage History
| Date | Status | Borrower | Loan Amount |
|---|---|---|---|
| Open | Flores Arnoldo | $157,050 | |
| Closed | Flores Arnoldo | $104,742 |
Source: Public Records
Tax History Compared to Growth
Tax History
| Year | Tax Paid | Tax Assessment Tax Assessment Total Assessment is a certain percentage of the fair market value that is determined by local assessors to be the total taxable value of land and additions on the property. | Land | Improvement |
|---|---|---|---|---|
| 2025 | $3,260 | $248,912 | $135,907 | $113,005 |
| 2024 | $3,260 | $244,033 | $133,243 | $110,790 |
| 2023 | $3,202 | $239,249 | $130,631 | $108,618 |
| 2022 | $3,060 | $234,559 | $128,070 | $106,489 |
| 2021 | $3,018 | $229,960 | $125,559 | $104,401 |
| 2019 | $2,933 | $223,141 | $121,836 | $101,305 |
| 2018 | $2,787 | $218,767 | $119,448 | $99,319 |
| 2016 | $2,652 | $210,273 | $114,810 | $95,463 |
| 2015 | $2,614 | $207,116 | $113,086 | $94,030 |
| 2014 | $2,632 | $203,060 | $110,871 | $92,189 |
Source: Public Records
Map
Nearby Homes
- 13046 Kelowna St
- 9961 Haddon Ave
- 13039 Kelowna St
- 12985 Kagel Canyon St
- 13032 Glamis St
- 13154 Garber St
- 9689 Kewen Ave
- 9688 Kewen Ave
- 10397 San Fernando
- 9076 9078 Lev Ave
- 10028 San Fernando Rd Unit 34
- 10028 San Fernando Rd
- 12519 Montague St
- 10004 San Fernando Rd
- 9547 Rincon Ave
- 13365 Garber St
- 10414 El Dorado Ave
- 12438 Correnti St
- 12466 Osborne St
- 10226 Amboy Ave
- 12929 Osborne St
- 12919 Osborne St
- 12933 Osborne St
- 12915 Osborne St
- 12909 Osborne St
- 12937 Osborne St
- 12962 Sunburst St
- 12966 Sunburst St
- 12956 Sunburst St
- 12972 Sunburst St
- 12952 Sunburst St
- 12941 Osborne St
- 12905 Osborne St
- 12976 Sunburst St
- 12946 Sunburst St
- 12922 Osborne St
- 12918 Osborne St
- 12945 Osborne St
- 12901 Osborne St
- 12982 Sunburst St