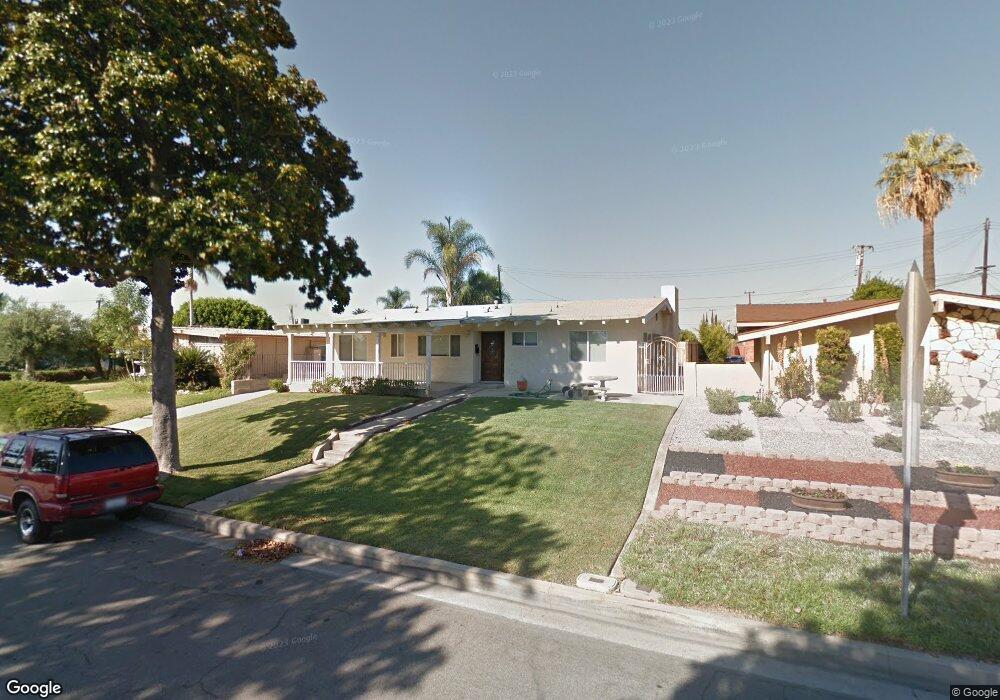
12929 Wicker Dr La Mirada, CA 90638
Estimated Value: $886,282 - $952,000
3
Beds
2
Baths
1,500
Sq Ft
$612/Sq Ft
Est. Value
About This Home
This home is located at 12929 Wicker Dr, La Mirada, CA 90638 and is currently estimated at $918,071, approximately $612 per square foot. 12929 Wicker Dr is a home located in Los Angeles County with nearby schools including Gardenhill Elementary School, Arlie F. Hutchinson Middle School, and La Mirada High School.
Ownership History
Date
Name
Owned For
Owner Type
Purchase Details
Closed on
Aug 8, 2006
Sold by
Clark Carla G
Bought by
Clark Paul E
Current Estimated Value
Home Financials for this Owner
Home Financials are based on the most recent Mortgage that was taken out on this home.
Original Mortgage
$350,000
Outstanding Balance
$207,265
Interest Rate
6.7%
Mortgage Type
New Conventional
Estimated Equity
$710,806
Purchase Details
Closed on
Jan 16, 1996
Sold by
Watkins Stanley and Watkins Terri
Bought by
Clark Paul E and Clark Carla G
Home Financials for this Owner
Home Financials are based on the most recent Mortgage that was taken out on this home.
Original Mortgage
$148,500
Interest Rate
7.14%
Create a Home Valuation Report for This Property
The Home Valuation Report is an in-depth analysis detailing your home's value as well as a comparison with similar homes in the area
Home Values in the Area
Average Home Value in this Area
Purchase History
| Date | Buyer | Sale Price | Title Company |
|---|---|---|---|
| Clark Paul E | -- | Ticor Title Co Glendale | |
| Clark Paul E | $165,000 | Southland Title Corporation |
Source: Public Records
Mortgage History
| Date | Status | Borrower | Loan Amount |
|---|---|---|---|
| Open | Clark Paul E | $350,000 | |
| Closed | Clark Paul E | $148,500 |
Source: Public Records
Tax History
| Year | Tax Paid | Tax Assessment Tax Assessment Total Assessment is a certain percentage of the fair market value that is determined by local assessors to be the total taxable value of land and additions on the property. | Land | Improvement |
|---|---|---|---|---|
| 2025 | $4,455 | $313,948 | $147,835 | $166,113 |
| 2024 | $4,270 | $307,793 | $144,937 | $162,856 |
| 2023 | $4,132 | $301,759 | $142,096 | $159,663 |
| 2022 | $4,059 | $295,843 | $139,310 | $156,533 |
| 2021 | $3,999 | $290,043 | $136,579 | $153,464 |
| 2020 | $3,905 | $287,070 | $135,179 | $151,891 |
| 2019 | $3,886 | $281,442 | $132,529 | $148,913 |
| 2018 | $3,653 | $275,925 | $129,931 | $145,994 |
| 2016 | $3,495 | $265,213 | $124,887 | $140,326 |
| 2015 | $3,464 | $261,231 | $123,012 | $138,219 |
| 2014 | $3,234 | $256,115 | $120,603 | $135,512 |
Source: Public Records
Map
Nearby Homes
- 14855 Valeda Dr
- 14829 Gagely Dr
- 13233 Oakwood Ln
- 11101 E Imperial Hwy Unit 69
- 14508 Sabine Dr
- 14753 Keese Dr
- 12628 Edderton Ave
- 14356 Coolbank Dr
- 14617 Cortina Dr
- 14428 Chere Dr
- 14740 Fairacres Dr
- 12205 Colima Rd
- 11744 Hollyview Dr
- 11906 Bluefield Ave
- 13431 Marlette Dr
- 14326 Tedford Dr
- 15216 Mccann Place
- 12700 Oakthorn Ln
- 13627 De Alcala Dr
- 12603 Oakthorn Ln
- 12921 Wicker Dr
- 14845 Valeda Dr
- 12911 Wicker Dr
- 14839 Valeda Dr
- 12930 Wicker Dr
- 14860 Tacuba Dr
- 12924 Wicker Dr
- 12936 Wicker Dr
- 14854 Valeda Dr
- 12918 Wicker Dr
- 12903 Wicker Dr
- 14854 Tacuba Dr
- 14833 Valeda Dr
- 12942 Wicker Dr
- 14846 Valeda Dr
- 12914 Wicker Dr
- 14840 Valeda Dr
- 14850 Tacuba Dr
- 12908 Wicker Dr
- 13009 Wicker Dr
Your Personal Tour Guide
Ask me questions while you tour the home.