
Landlord's Agent in 2023
Kelsay Bolden
T&H Realty Services, Inc.
(317) 800-9248
Estimated Value: $279,000 - $284,669
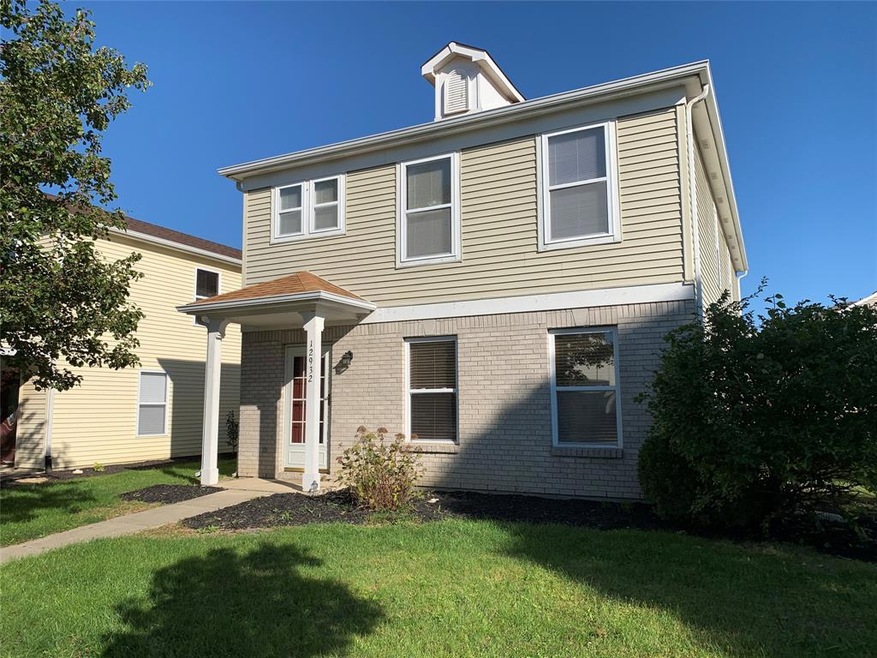
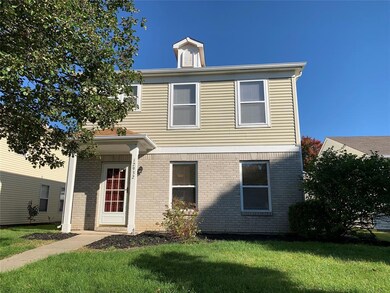
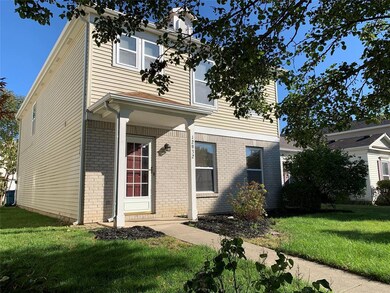
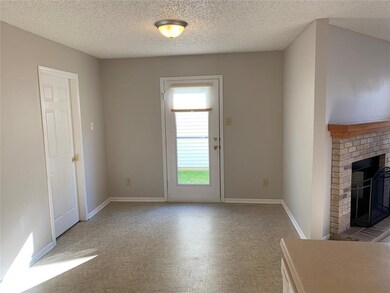
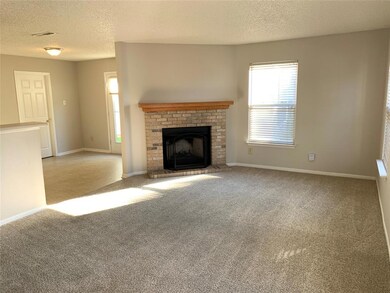
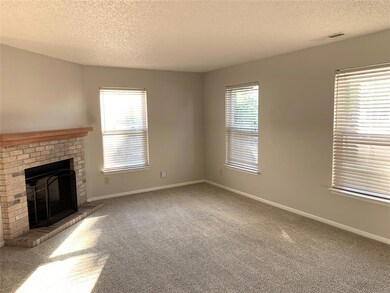
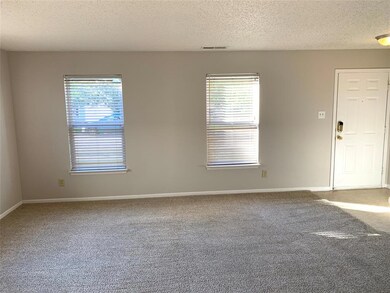
**Refundable Application Fee at Successful Move-in** This nice 2-Story is located in Brooks Chase off 131st & Olio, minutes to I-69, Saxony Beach and Hamilton Town Center. Home features 3 bedroom, 2.5 baths plus a loft with a large eat-in kitchen including all appliances. The Primary suite includes a garden tub, separate shower and huge walk-in closet. Hamilton Southeastern Schools! Pets Negotiable! Note: In addition to the monthly rent, Tenant will pay an additional $45 each month for a Resident Benefits Package. Details can be found here: www.threaltyinc.com/rbp
Last Agent to Rent the Property
T&H Realty Services, Inc. License #RB22000155 Listed on: 09/30/2022
Last Renter's Agent
T&H Realty Services, Inc. License #RB22000155 Listed on: 09/30/2022
Home Type
Est. Annual Taxes
Year Built
Lot Details
Parking
Home Design
Interior Spaces
Kitchen
Flooring
Bedrooms and Bathrooms
Utilities
Community Details
Listing and Financial Details
| Date | Buyer | Sale Price | Title Company |
|---|---|---|---|
| Robles Israei | -- | Fidelity National Title | |
| Hoskins Deborah | -- | None Available | |
| Chapman Jimmie G | -- | None Available | |
| Chapman Jimmie G | -- | -- |
| Date | Status | Borrower | Loan Amount |
|---|---|---|---|
| Open | Robles Israel | $99,000 | |
| Closed | Robles Israei | $100,500 |
| Date | Event | Price | Change | Sq Ft Price |
|---|---|---|---|---|
| 02/24/2023 02/24/23 | Rented | $1,625 | 0.0% | -- |
| 02/16/2023 02/16/23 | Under Contract | -- | -- | -- |
| 01/27/2023 01/27/23 | For Rent | $1,625 | 0.0% | -- |
| 01/26/2023 01/26/23 | Under Contract | -- | -- | -- |
| 12/28/2022 12/28/22 | Price Changed | $1,625 | -3.0% | $1 / Sq Ft |
| 12/09/2022 12/09/22 | Price Changed | $1,675 | -1.5% | $1 / Sq Ft |
| 11/21/2022 11/21/22 | Price Changed | $1,700 | -2.9% | $1 / Sq Ft |
| 11/07/2022 11/07/22 | Price Changed | $1,750 | -2.8% | $1 / Sq Ft |
| 10/18/2022 10/18/22 | Price Changed | $1,800 | -5.3% | $1 / Sq Ft |
| 09/30/2022 09/30/22 | For Rent | $1,900 | +22.6% | -- |
| 06/17/2021 06/17/21 | Rented | -- | -- | -- |
| 06/09/2021 06/09/21 | Under Contract | -- | -- | -- |
| 06/07/2021 06/07/21 | For Rent | -- | -- | -- |
| 05/13/2021 05/13/21 | Under Contract | -- | -- | -- |
| 05/10/2021 05/10/21 | For Rent | $1,550 | +8.0% | -- |
| 02/27/2020 02/27/20 | Rented | $1,435 | +2.5% | -- |
| 02/17/2020 02/17/20 | Under Contract | -- | -- | -- |
| 02/03/2020 02/03/20 | For Rent | $1,400 | +7.7% | -- |
| 08/22/2019 08/22/19 | Rented | $1,300 | 0.0% | -- |
| 08/14/2019 08/14/19 | Under Contract | -- | -- | -- |
| 08/02/2019 08/02/19 | For Rent | $1,300 | +18.7% | -- |
| 10/28/2016 10/28/16 | Rented | $1,095 | 0.0% | -- |
| 10/13/2016 10/13/16 | Price Changed | $1,095 | -8.4% | $1 / Sq Ft |
| 10/07/2016 10/07/16 | Price Changed | $1,195 | -7.7% | $1 / Sq Ft |
| 09/15/2016 09/15/16 | For Rent | $1,295 | 0.0% | -- |
| 08/08/2016 08/08/16 | Sold | $134,000 | 0.0% | $82 / Sq Ft |
| 07/13/2016 07/13/16 | Off Market | $134,000 | -- | -- |
| 07/01/2016 07/01/16 | For Sale | $139,900 | +4.4% | $86 / Sq Ft |
| 06/27/2016 06/27/16 | Off Market | $134,000 | -- | -- |
| 06/16/2016 06/16/16 | For Sale | $139,900 | -- | $86 / Sq Ft |
| Year | Tax Paid | Tax Assessment Tax Assessment Total Assessment is a certain percentage of the fair market value that is determined by local assessors to be the total taxable value of land and additions on the property. | Land | Improvement |
|---|---|---|---|---|
| 2024 | $4,837 | $231,500 | $27,400 | $204,100 |
| 2023 | $4,837 | $223,200 | $27,400 | $195,800 |
| 2022 | $4,395 | $196,300 | $27,400 | $168,900 |
| 2021 | $3,660 | $160,600 | $27,400 | $133,200 |
| 2020 | $3,241 | $139,800 | $27,400 | $112,400 |
| 2019 | $3,016 | $129,400 | $20,400 | $109,000 |
| 2018 | $2,869 | $123,000 | $20,400 | $102,600 |
| 2017 | $2,840 | $123,100 | $20,400 | $102,700 |
| 2016 | $1,099 | $117,300 | $20,400 | $96,900 |
| 2014 | $917 | $111,100 | $14,200 | $96,900 |
| 2013 | $917 | $106,300 | $14,200 | $92,100 |
Landlord's Agent in 2023
Kelsay Bolden
T&H Realty Services, Inc.
(317) 800-9248
Seller's Agent in 2021
Jeremy Tallman
T&H Realty Services, Inc.
(317) 442-3010
3 Total Sales
C
Seller Co-Listing Agent in 2021
Claire Holdsworth
JUST LIV, LLC
D
Seller's Agent in 2016
David Hoyt
eXp Realty, LLC
I
Seller's Agent in 2016
Ivan Barratt
C
Buyer's Agent in 2016
Christopher Jones
Keller Williams Indy
Source: MIBOR Broker Listing Cooperative®
MLS Number: 21886197
APN: 29-11-26-021-025.000-020
Disclaimer: Certain information contained herein is derived from information provided by parties other than Homes.com. All information provided is deemed reliable, but is not guaranteed to be accurate and should be independently verified.
![]() Based on information submitted to the MLS GRID. All data is obtained from various sources and may not have been verified by broker or MLS GRID. Supplied Open House Information is subject to change without notice. All information should be independently reviewed and verified for accuracy. Properties may or may not be listed by the office/agent presenting the information. Some IDX listings have been excluded from this website.
Based on information submitted to the MLS GRID. All data is obtained from various sources and may not have been verified by broker or MLS GRID. Supplied Open House Information is subject to change without notice. All information should be independently reviewed and verified for accuracy. Properties may or may not be listed by the office/agent presenting the information. Some IDX listings have been excluded from this website.