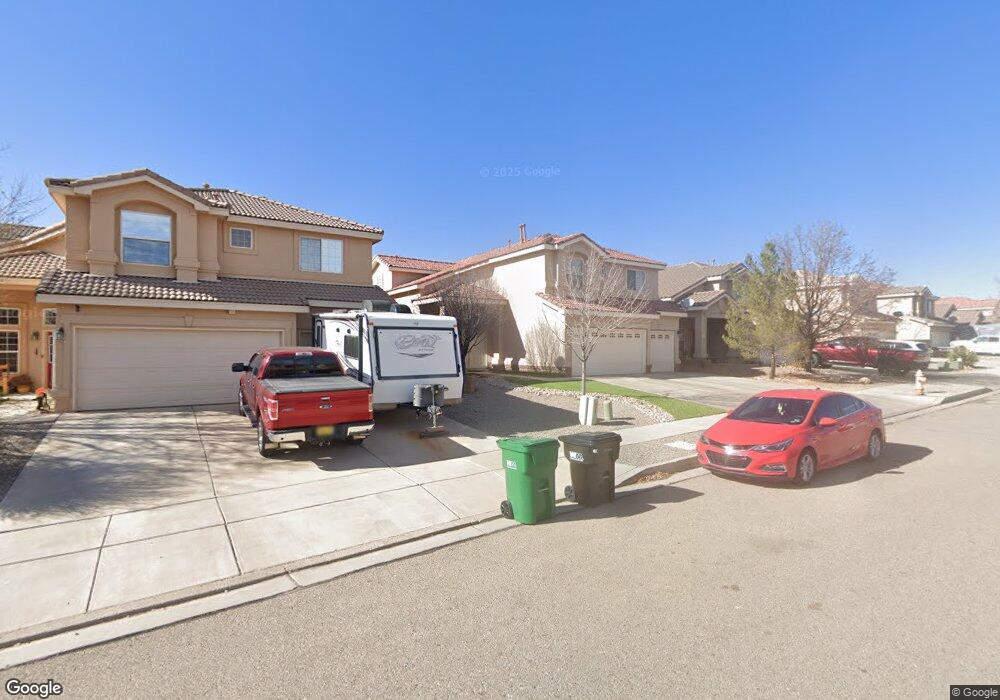
1294 Mirador Loop NE Rio Rancho, NM 87144
Central Rio Rancho NeighborhoodEstimated Value: $400,000 - $423,000
4
Beds
4
Baths
2,946
Sq Ft
$140/Sq Ft
Est. Value
About This Home
This home is located at 1294 Mirador Loop NE, Rio Rancho, NM 87144 and is currently estimated at $411,295, approximately $139 per square foot. 1294 Mirador Loop NE is a home with nearby schools including Ernest Stapleton Elementary School, Eagle Ridge Middle School, and Cleveland High School.
Ownership History
Date
Name
Owned For
Owner Type
Purchase Details
Closed on
Oct 14, 2021
Sold by
Guerra Felix S Orpinel and Orpinel Claudia S
Bought by
Guerra Felix S Orpinel and Orpinel Claudia S
Current Estimated Value
Home Financials for this Owner
Home Financials are based on the most recent Mortgage that was taken out on this home.
Original Mortgage
$166,700
Outstanding Balance
$152,015
Interest Rate
2.8%
Mortgage Type
New Conventional
Estimated Equity
$259,280
Purchase Details
Closed on
Jan 3, 2020
Sold by
Orpinel Orus O
Bought by
Orpinel Felix S and Orpinel Claudia S
Purchase Details
Closed on
Nov 17, 2006
Sold by
Homes By Kim Brooks Inc
Bought by
Orpinel Orus O
Home Financials for this Owner
Home Financials are based on the most recent Mortgage that was taken out on this home.
Original Mortgage
$228,721
Interest Rate
6.37%
Mortgage Type
New Conventional
Create a Home Valuation Report for This Property
The Home Valuation Report is an in-depth analysis detailing your home's value as well as a comparison with similar homes in the area
Home Values in the Area
Average Home Value in this Area
Purchase History
| Date | Buyer | Sale Price | Title Company |
|---|---|---|---|
| Guerra Felix S Orpinel | -- | Nmltco | |
| Orpinel Felix S | -- | None Available | |
| Orpinel Orus O | $304,199 | Fidelity National Title Insura |
Source: Public Records
Mortgage History
| Date | Status | Borrower | Loan Amount |
|---|---|---|---|
| Open | Guerra Felix S Orpinel | $166,700 | |
| Closed | Orpinel Orus O | $228,721 |
Source: Public Records
Tax History Compared to Growth
Tax History
| Year | Tax Paid | Tax Assessment Tax Assessment Total Assessment is a certain percentage of the fair market value that is determined by local assessors to be the total taxable value of land and additions on the property. | Land | Improvement |
|---|---|---|---|---|
| 2025 | $2,679 | $76,572 | $12,395 | $64,177 |
| 2024 | $2,638 | $74,342 | $11,840 | $62,502 |
| 2023 | $2,638 | $72,177 | $11,183 | $60,994 |
| 2022 | $2,561 | $70,075 | $10,667 | $59,408 |
| 2021 | $2,512 | $68,034 | $10,667 | $57,367 |
| 2020 | $2,468 | $66,053 | $0 | $0 |
| 2019 | $2,337 | $64,129 | $0 | $0 |
| 2018 | $2,132 | $62,262 | $0 | $0 |
| 2017 | $2,042 | $60,448 | $0 | $0 |
| 2016 | $2,218 | $58,688 | $0 | $0 |
| 2014 | $2,144 | $58,688 | $0 | $0 |
| 2013 | -- | $73,029 | $14,667 | $58,362 |
Source: Public Records
Map
Nearby Homes
- 1311 Mirador Loop NE
- 1207 Mirador Loop NE
- 1189 Fascination St NE
- 1170 Grace St NE
- 1250 Inca Rd NE
- 1219 Grace St NE
- 2641 Camino Azul NE
- 2613 Camino Plata Loop NE
- 2634 Camino Plata Loop NE
- 1110 Grace St NE
- Selena Plan at Scottish Isle
- Maya Plan at Scottish Isle
- Frida Lux Plan at Scottish Isle
- Taylor II Plan at Scottish Isle
- Coco II Plan at Scottish Isle
- Jane Plan at Scottish Isle
- Tabitha II Plan at Scottish Isle
- 2667 Camino Azul Loop NE
- 2696 Camino Plata Loop NE
- 2317 Solara Loop NE
- 1290 Mirador Loop NE
- 1298 Mirador Loop NE
- 1286 Mirador Loop NE
- 1176 Mirador Loop NE
- 1291 Mirador Loop NE
- 1172 Mirador Loop
- 1172 Mirador Loop NE
- 1180 Mirador Loop
- 1180 Mirador Loop NE
- 1295 Mirador Loop N E
- 1295 Mirador Loop NE
- 1299 Mirador Loop NE
- 1282 Mirador Loop NE
- 1184 Mirador Loop North E
- 1184 Mirador Loop N
- 1184 Mirador Loop
- 1168 Mirador Loop NE
- 1287 Mirador Loop
- 1287 Mirador Loop North E
- 1303 Mirador Loop NE