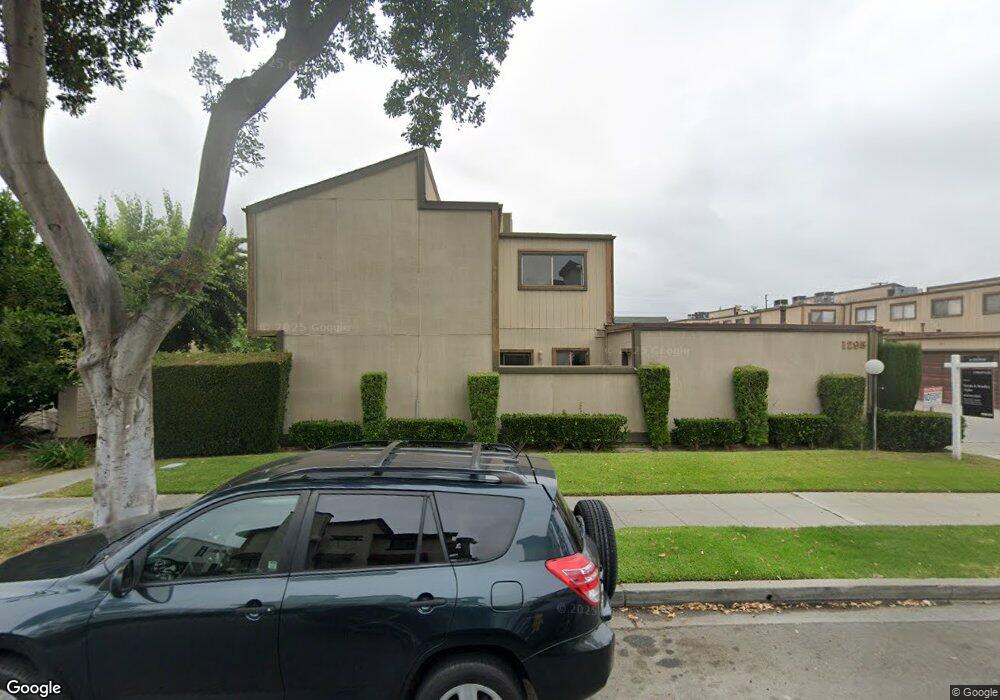
1295 Elm Ave Unit C San Gabriel, CA 91775
Estimated Value: $587,085 - $691,000
3
Beds
2
Baths
1,026
Sq Ft
$620/Sq Ft
Est. Value
About This Home
This home is located at 1295 Elm Ave Unit C, San Gabriel, CA 91775 and is currently estimated at $635,771, approximately $619 per square foot. 1295 Elm Ave Unit C is a home located in Los Angeles County with nearby schools including Wilson Elementary School, Jefferson Middle School, and Gabrielino High School.
Ownership History
Date
Name
Owned For
Owner Type
Purchase Details
Closed on
Feb 11, 2015
Sold by
Tang Alice Jin J
Bought by
The Liu Family Revocable Trust
Current Estimated Value
Purchase Details
Closed on
Apr 26, 1996
Sold by
Rosen Benjamin
Bought by
Tang Alice Jin J
Home Financials for this Owner
Home Financials are based on the most recent Mortgage that was taken out on this home.
Original Mortgage
$82,400
Outstanding Balance
$4,618
Interest Rate
7.82%
Estimated Equity
$631,153
Purchase Details
Closed on
Apr 15, 1996
Sold by
Liu Lie Meng
Bought by
Tang Alice Jin J
Home Financials for this Owner
Home Financials are based on the most recent Mortgage that was taken out on this home.
Original Mortgage
$82,400
Outstanding Balance
$4,618
Interest Rate
7.82%
Estimated Equity
$631,153
Purchase Details
Closed on
May 24, 1994
Sold by
Barnett Weinberger Inc
Bought by
Rosen Benjamin
Create a Home Valuation Report for This Property
The Home Valuation Report is an in-depth analysis detailing your home's value as well as a comparison with similar homes in the area
Home Values in the Area
Average Home Value in this Area
Purchase History
| Date | Buyer | Sale Price | Title Company |
|---|---|---|---|
| The Liu Family Revocable Trust | -- | None Available | |
| Tang Alice Jin J | $103,000 | -- | |
| Tang Alice Jin J | -- | -- | |
| Rosen Benjamin | $37,446 | -- |
Source: Public Records
Mortgage History
| Date | Status | Borrower | Loan Amount |
|---|---|---|---|
| Open | Tang Alice Jin J | $82,400 |
Source: Public Records
Tax History Compared to Growth
Tax History
| Year | Tax Paid | Tax Assessment Tax Assessment Total Assessment is a certain percentage of the fair market value that is determined by local assessors to be the total taxable value of land and additions on the property. | Land | Improvement |
|---|---|---|---|---|
| 2025 | $2,592 | $171,247 | $54,474 | $116,773 |
| 2024 | $2,592 | $167,890 | $53,406 | $114,484 |
| 2023 | $2,547 | $164,599 | $52,359 | $112,240 |
| 2022 | $2,448 | $161,373 | $51,333 | $110,040 |
| 2021 | $2,425 | $158,210 | $50,327 | $107,883 |
| 2019 | $2,327 | $153,519 | $48,835 | $104,684 |
| 2018 | $2,294 | $150,510 | $47,878 | $102,632 |
| 2016 | $2,183 | $144,668 | $46,020 | $98,648 |
| 2015 | $2,153 | $142,496 | $45,329 | $97,167 |
| 2014 | $2,140 | $139,706 | $44,442 | $95,264 |
Source: Public Records
Map
Nearby Homes
- 1230 Elm Ave Unit G
- 1290 Elm Ave Unit D
- 1349 Elm Ave
- 1120 E Las Tunas Dr Unit 2
- 6013 N Walnut Grove Ave
- 6138 Avon Ave
- 5823 Myda Ave
- 1281 E Broadway
- 5716 N Charlotte Ave
- 0 Sultana Ave
- 6137 Rosemead Blvd
- 6250 Deerfield Ave
- 6159 Rosemead Blvd
- 118 N Gladys Ave Unit F
- 5619 Sultana Ave Unit A
- 5613 N Charlotte Ave
- 5635 Noel Dr
- 6227 Sultana Ave
- 101 N San Gabriel Blvd
- 345 N San Gabriel Blvd
- 1295 Elm Ave
- 1295 Elm Ave Unit J
- 1295 Elm Ave Unit I
- 1295 Elm Ave Unit H
- 1295 Elm Ave Unit G
- 1295 Elm Ave Unit F
- 1295 Elm Ave Unit E
- 1295 Elm Ave Unit D
- 1295 Elm Ave Unit B
- 1295 Elm Ave Unit A
- 1305 Elm Ave Unit J
- 1305 Elm Ave Unit I
- 1305 Elm Ave Unit H
- 1305 Elm Ave Unit G
- 1305 Elm Ave Unit F
- 1305 Elm Ave Unit E
- 1305 Elm Ave Unit D
- 1305 Elm Ave Unit C
- 1305 Elm Ave Unit B
- 1305 Elm Ave Unit A