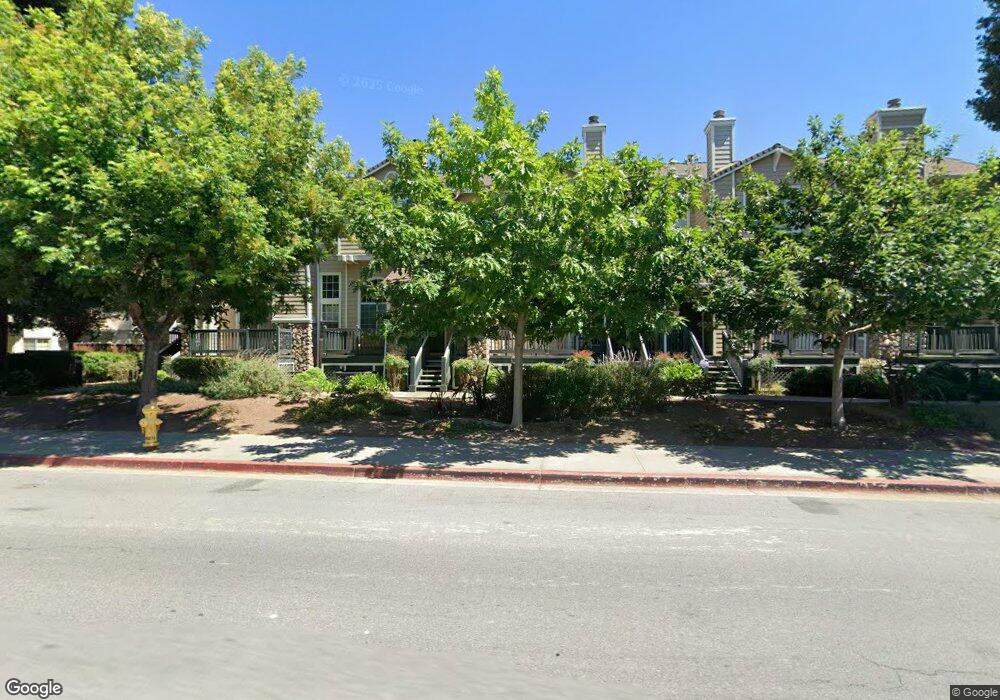
1296 Eagle Pointe Landing Unit 115 San Jose, CA 95131
North Valley NeighborhoodEstimated Value: $907,000 - $1,161,000
2
Beds
3
Baths
1,181
Sq Ft
$840/Sq Ft
Est. Value
About This Home
This home is located at 1296 Eagle Pointe Landing Unit 115, San Jose, CA 95131 and is currently estimated at $991,680, approximately $839 per square foot. 1296 Eagle Pointe Landing Unit 115 is a home located in Santa Clara County with nearby schools including Orchard Elementary School, Independence High School, and Challenger School - Berryessa.
Ownership History
Date
Name
Owned For
Owner Type
Purchase Details
Closed on
Jan 18, 2005
Sold by
Sue Kenneth R and Ho Lily D
Bought by
Chang Weiche
Current Estimated Value
Home Financials for this Owner
Home Financials are based on the most recent Mortgage that was taken out on this home.
Original Mortgage
$287,000
Outstanding Balance
$136,400
Interest Rate
4.87%
Mortgage Type
Assumption
Estimated Equity
$855,280
Purchase Details
Closed on
Jan 5, 2001
Sold by
Maat Karl J
Bought by
Sue Kenneth R and Ho Lily D
Home Financials for this Owner
Home Financials are based on the most recent Mortgage that was taken out on this home.
Original Mortgage
$357,200
Interest Rate
7.37%
Purchase Details
Closed on
Sep 22, 1995
Sold by
Kaufman & Broad South Bay Inc
Bought by
Maat Karl Jay
Home Financials for this Owner
Home Financials are based on the most recent Mortgage that was taken out on this home.
Original Mortgage
$162,850
Interest Rate
7.88%
Mortgage Type
Seller Take Back
Create a Home Valuation Report for This Property
The Home Valuation Report is an in-depth analysis detailing your home's value as well as a comparison with similar homes in the area
Home Values in the Area
Average Home Value in this Area
Purchase History
| Date | Buyer | Sale Price | Title Company |
|---|---|---|---|
| Chang Weiche | $507,000 | Chicago Title | |
| Sue Kenneth R | $446,500 | Chicago Title Co | |
| Maat Karl Jay | -- | Chicago Title Co | |
| Maat Karl Jay | $181,500 | First American Title Guarant |
Source: Public Records
Mortgage History
| Date | Status | Borrower | Loan Amount |
|---|---|---|---|
| Open | Chang Weiche | $287,000 | |
| Previous Owner | Sue Kenneth R | $357,200 | |
| Previous Owner | Maat Karl Jay | $162,850 |
Source: Public Records
Tax History
| Year | Tax Paid | Tax Assessment Tax Assessment Total Assessment is a certain percentage of the fair market value that is determined by local assessors to be the total taxable value of land and additions on the property. | Land | Improvement |
|---|---|---|---|---|
| 2025 | $9,117 | $706,698 | $282,677 | $424,021 |
| 2024 | $9,117 | $692,842 | $277,135 | $415,707 |
| 2023 | $8,928 | $679,257 | $271,701 | $407,556 |
| 2022 | $8,892 | $665,939 | $266,374 | $399,565 |
| 2021 | $8,762 | $652,882 | $261,151 | $391,731 |
| 2020 | $8,580 | $646,189 | $258,474 | $387,715 |
| 2019 | $8,434 | $633,519 | $253,406 | $380,113 |
| 2018 | $8,349 | $621,098 | $248,438 | $372,660 |
| 2017 | $8,226 | $608,920 | $243,567 | $365,353 |
| 2016 | $7,776 | $596,982 | $238,792 | $358,190 |
| 2015 | $7,635 | $581,000 | $232,400 | $348,600 |
| 2014 | $7,005 | $538,000 | $215,200 | $322,800 |
Source: Public Records
Map
Nearby Homes
- 1856 Elk Grove Landing
- 1756 Ringwood Ave Unit 104
- 1836 Fumia Place
- 703 Star Jasmine Ct
- 1252 Montcourse Ln
- 1437 Marcello Dr
- 951 Arrowleaf Place
- 1068 Bigleaf Place Unit 402
- 970 Arrowleaf Place
- 1057 Foxglove Place Unit 202
- 1601 Adolfo Dr
- 1117 Rock Ave
- 1057 Rock Ave
- 2152 Sheffield Dr Unit 67
- 0 Lundy Ave
- 1302 Fairway Entrance Dr
- 1309 Fairway Entrance Dr
- 1388 Meadow Ridge Cir Unit 143
- 1441 Rocklin Ct Unit 112
- 900 Golden Wheel Park Dr Unit 121
- 1294 Eagle Pointe Landing Unit 114
- 1298 Eagle Pointe Landing Unit 116
- 1151 1151
- 1292 Eagle Pointe Landing Unit 113
- 1290 Eagle Pointe Landing
- 1297 Eagle Pointe Landing Unit 118
- 1295 Eagle Pointe Landing Unit 119
- 1299 Eagle Pointe Landing
- 1279 Goose Pointe Common
- 1277 Goose Pointe Common Unit 21108
- 1281 Goose Pointe Common
- 1293 Eagle Pointe Landing
- 1275 Goose Pointe Common
- 1273 Goose Pointe Common
- 1291 Eagle Pointe Landing Unit 121
- 1219 Tea Rose Cir
- 1215 Tea Rose Cir
- 1271 Goose Pointe Common
- 1211 Tea Rose Cir
- 1207 Tea Rose Cir
Your Personal Tour Guide
Ask me questions while you tour the home.