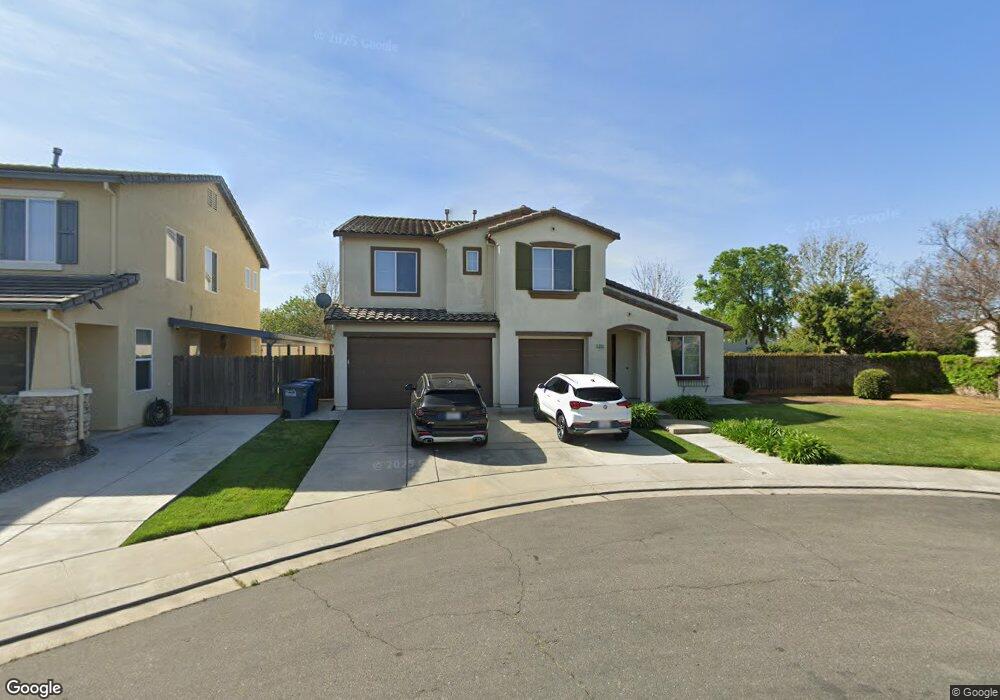
1296 Lurs Ct Merced, CA 95348
Estimated Value: $495,000 - $551,439
4
Beds
3
Baths
2,943
Sq Ft
$181/Sq Ft
Est. Value
About This Home
This home is located at 1296 Lurs Ct, Merced, CA 95348 and is currently estimated at $531,610, approximately $180 per square foot. 1296 Lurs Ct is a home located in Merced County with nearby schools including Franklin Elementary School, Herbert H. Cruickshank Middle School, and El Capitan High School.
Ownership History
Date
Name
Owned For
Owner Type
Purchase Details
Closed on
Dec 8, 2011
Sold by
Hsu Peter C and Hsu Carol S
Bought by
Hsu Peter C and Hsu Carol S
Current Estimated Value
Home Financials for this Owner
Home Financials are based on the most recent Mortgage that was taken out on this home.
Original Mortgage
$151,910
Outstanding Balance
$103,567
Interest Rate
3.94%
Mortgage Type
New Conventional
Estimated Equity
$428,043
Purchase Details
Closed on
Apr 15, 2009
Sold by
Us Bank National Association
Bought by
Hsu Peter C and Hsu Carol S
Purchase Details
Closed on
Jul 10, 2008
Sold by
Vang Bryan and Vang Kay
Bought by
Fa Downey Sla
Purchase Details
Closed on
Sep 7, 2005
Sold by
Centex Homes
Bought by
Vang Bryan and Vang Kay
Home Financials for this Owner
Home Financials are based on the most recent Mortgage that was taken out on this home.
Original Mortgage
$439,263
Interest Rate
6.72%
Mortgage Type
Fannie Mae Freddie Mac
Create a Home Valuation Report for This Property
The Home Valuation Report is an in-depth analysis detailing your home's value as well as a comparison with similar homes in the area
Home Values in the Area
Average Home Value in this Area
Purchase History
| Date | Buyer | Sale Price | Title Company |
|---|---|---|---|
| Hsu Peter C | -- | Old Republic Title Company | |
| Hsu Peter C | -- | Old Republic Title Company | |
| Hsu Peter C | $185,000 | Lawyers Title | |
| Fa Downey Sla | $183,750 | Accommodation | |
| Vang Bryan | $488,500 | Transcounty Title Company |
Source: Public Records
Mortgage History
| Date | Status | Borrower | Loan Amount |
|---|---|---|---|
| Open | Hsu Peter C | $151,910 | |
| Previous Owner | Vang Bryan | $439,263 |
Source: Public Records
Tax History Compared to Growth
Tax History
| Year | Tax Paid | Tax Assessment Tax Assessment Total Assessment is a certain percentage of the fair market value that is determined by local assessors to be the total taxable value of land and additions on the property. | Land | Improvement |
|---|---|---|---|---|
| 2025 | $3,619 | $238,219 | $38,625 | $199,594 |
| 2024 | $3,619 | $233,549 | $37,868 | $195,681 |
| 2023 | $3,551 | $228,971 | $37,126 | $191,845 |
| 2022 | $3,464 | $224,483 | $36,399 | $188,084 |
| 2021 | $3,387 | $220,083 | $35,686 | $184,397 |
| 2020 | $3,388 | $217,828 | $35,321 | $182,507 |
| 2019 | $3,329 | $213,558 | $34,629 | $178,929 |
| 2018 | $3,096 | $209,371 | $33,950 | $175,421 |
| 2017 | $3,153 | $205,267 | $33,285 | $171,982 |
| 2016 | $3,092 | $201,243 | $32,633 | $168,610 |
| 2015 | $3,041 | $198,221 | $32,143 | $166,078 |
| 2014 | $2,986 | $194,339 | $31,514 | $162,825 |
Source: Public Records
Map
Nearby Homes
- 3954 Menton Ct
- 1269 Lurs Ct
- 1264 Verdon Ct
- 1289 Verdon Ct
- 4032 Wood Creek Ct
- 1216 Aups Ct
- 1207 Strawberry Dr
- 3803 Colma Ct
- 4096 Toulon Ct
- 1240 Pacific Dr
- Jay Plan at Crest View
- Lanner Plan at Crest View
- Nightingale Plan at Crest View
- 4119 Anise Ct
- 1242 Sunup Dr
- 4113 Clary Ct
- 4104 Clary Ct
- 1420 Antioch Ct
- 4112 Clary Ct
- 1169 Crescent Dr