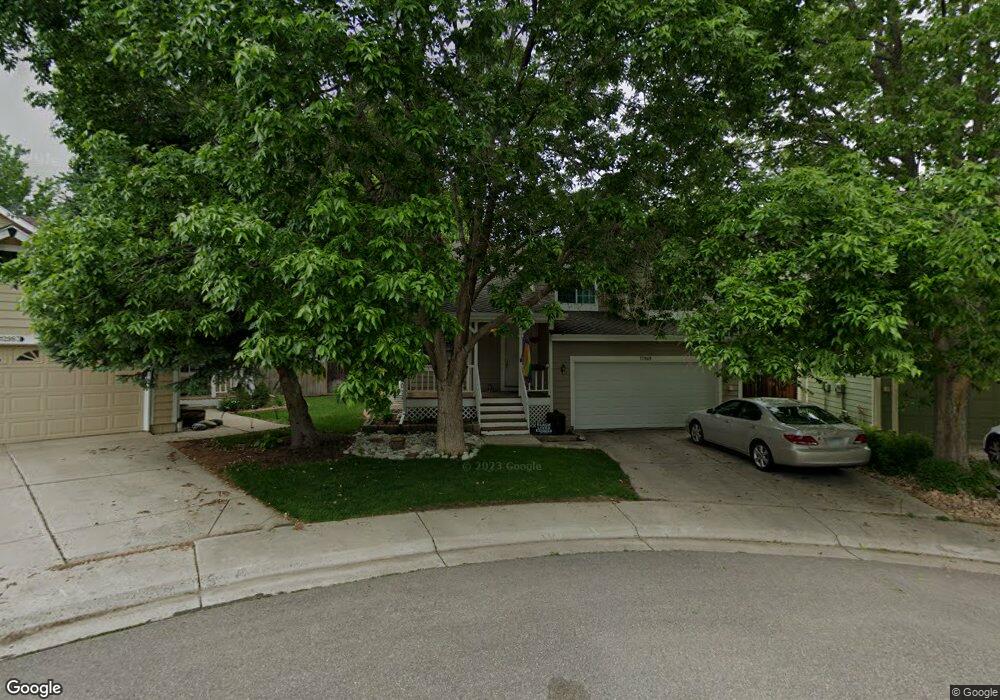
12969 S Carson Ct Parker, CO 80134
Stroh Ranch NeighborhoodEstimated Value: $537,000 - $549,000
3
Beds
4
Baths
1,714
Sq Ft
$317/Sq Ft
Est. Value
About This Home
This home is located at 12969 S Carson Ct, Parker, CO 80134 and is currently estimated at $543,335, approximately $316 per square foot. 12969 S Carson Ct is a home located in Douglas County with nearby schools including Legacy Point Elementary School, Sagewood Middle School, and Ponderosa High School.
Ownership History
Date
Name
Owned For
Owner Type
Purchase Details
Closed on
Jul 25, 2006
Sold by
Hubbard David M and Smith Marilyn J
Bought by
Guthrie Ryan B
Current Estimated Value
Home Financials for this Owner
Home Financials are based on the most recent Mortgage that was taken out on this home.
Original Mortgage
$168,000
Outstanding Balance
$97,986
Interest Rate
6.62%
Mortgage Type
Unknown
Estimated Equity
$445,349
Purchase Details
Closed on
Mar 26, 2002
Sold by
Belter Kris E and Belter Janet H
Bought by
Hubbard David M and Smith Everett J
Home Financials for this Owner
Home Financials are based on the most recent Mortgage that was taken out on this home.
Original Mortgage
$226,303
Interest Rate
6.83%
Mortgage Type
FHA
Purchase Details
Closed on
Nov 22, 1991
Sold by
Tcr Stroh Ranch Ii Ltd Partnership
Bought by
Belter Kris E and Belter Janet H
Purchase Details
Closed on
Feb 11, 1991
Sold by
Stroh Ranch Dev Ltd
Bought by
Tcr Stroh Ranch Ii Ltd
Create a Home Valuation Report for This Property
The Home Valuation Report is an in-depth analysis detailing your home's value as well as a comparison with similar homes in the area
Home Values in the Area
Average Home Value in this Area
Purchase History
| Date | Buyer | Sale Price | Title Company |
|---|---|---|---|
| Guthrie Ryan B | $210,000 | Security Title | |
| Hubbard David M | $229,500 | Stewart Title | |
| Belter Kris E | -- | -- | |
| Belter Kris E | $113,000 | -- | |
| Tcr Stroh Ranch Ii Ltd | -- | -- |
Source: Public Records
Mortgage History
| Date | Status | Borrower | Loan Amount |
|---|---|---|---|
| Open | Guthrie Ryan B | $168,000 | |
| Previous Owner | Hubbard David M | $226,303 |
Source: Public Records
Tax History
| Year | Tax Paid | Tax Assessment Tax Assessment Total Assessment is a certain percentage of the fair market value that is determined by local assessors to be the total taxable value of land and additions on the property. | Land | Improvement |
|---|---|---|---|---|
| 2025 | $3,166 | $35,630 | $8,070 | $27,560 |
| 2024 | $3,166 | $41,850 | $8,390 | $33,460 |
| 2023 | $3,201 | $41,850 | $8,390 | $33,460 |
| 2022 | $2,330 | $29,000 | $5,090 | $23,910 |
| 2021 | $2,426 | $29,000 | $5,090 | $23,910 |
| 2020 | $2,309 | $28,260 | $4,750 | $23,510 |
| 2019 | $2,629 | $28,260 | $4,750 | $23,510 |
| 2018 | $2,443 | $24,510 | $4,850 | $19,660 |
| 2017 | $2,290 | $24,510 | $4,850 | $19,660 |
| 2016 | $2,137 | $21,980 | $3,980 | $18,000 |
| 2015 | $2,182 | $21,980 | $3,980 | $18,000 |
| 2014 | $2,114 | $18,860 | $3,980 | $14,880 |
Source: Public Records
Map
Nearby Homes
- 19139 E Legend Ave
- 13024 S Stuart Way
- 19113 E Molly Ave
- 19382 Dunraven St
- 12905 S Bonney St
- 13073 S Stuart Way
- 19025 E Molly Ave
- 6484 Stroh Rd
- 13022 Coffee Tree St
- 13071 Coffee Tree St
- 12886 Ironstone Way Unit 303
- 12931 Ironstone Way Unit 303
- 12935 Ironstone Way Unit 302
- 12858 Ironstone Way Unit 301
- 12858 Ironstone Way Unit 204
- 12858 Ironstone Way Unit 102
- 18669 Stroh Rd Unit 10005
- 12824 Ironstone Way Unit 303
- 12766 Ironstone Way Unit 201
- 12768 Ironstone Way Unit 204
- 12955 S Carson Ct
- 19095 E Bonney Ct
- 12983 S Carson Ct
- 19088 E Bonney Ct
- 12941 S Carson Ct
- 12991 S Carson Ct
- 19075 E Bonney Ct
- 12927 S Carson Ct
- 19110 E Molly Ave
- 19120 E Molly Ave
- 12996 S Carson Ct
- 12964 S Carson Ct
- 19155 E Legend Ave
- 12913 S Carson Ct
- 19171 E Legend Ave
- 12948 S Carson Ct
- 19038 E Bonney Ct
- 19055 E Bonney Ct
- 19090 E Molly Ave
- 19187 E Legend Ave
Your Personal Tour Guide
Ask me questions while you tour the home.