S
Landlord's Agent in 2017
Shelby Farrar
Opendoor Brokerage LLC
Estimated Value: $293,000 - $306,000
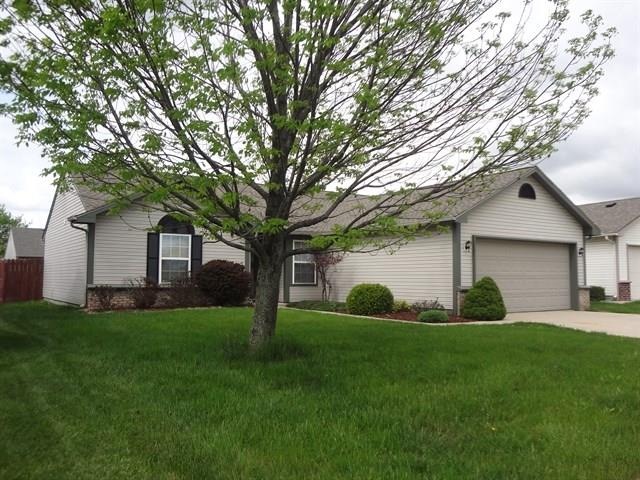
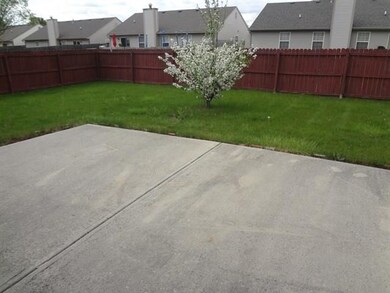
This home is located at 12977 Galloway Cir, Fishers, IN 46038 since 08 August 2017 and is currently priced at $298,619. This property was built in 1995. 12977 Galloway Cir is a home located in Hamilton County with nearby schools including Cumberland Road Elementary School, East Middle School, and Fishers Junior High School.
Last Agent to Rent the Property
Opendoor Brokerage LLC License #RB14048287 Listed on: 08/08/2017
| Date | Buyer | Sale Price | Title Company |
|---|---|---|---|
| Amh 2014-3 Borrower Llc | -- | None Available | |
| American Homes 4 Rent Properties Three L | $105,000 | None Available | |
| Nickles Jimmy S | -- | -- |
| Date | Status | Borrower | Loan Amount |
|---|---|---|---|
| Previous Owner | Nickles Jimmy S | $112,985 |
| Date | Event | Price | List to Sale | Price per Sq Ft |
|---|---|---|---|---|
| 08/18/2017 08/18/17 | Rented | $1,350 | 0.0% | -- |
| 08/08/2017 08/08/17 | For Rent | $1,350 | +12.5% | -- |
| 05/14/2013 05/14/13 | Rented | $1,200 | 0.0% | -- |
| 05/14/2013 05/14/13 | Under Contract | -- | -- | -- |
| 05/07/2013 05/07/13 | For Rent | $1,200 | -- | -- |
| Year | Tax Paid | Tax Assessment Tax Assessment Total Assessment is a certain percentage of the fair market value that is determined by local assessors to be the total taxable value of land and additions on the property. | Land | Improvement |
|---|---|---|---|---|
| 2024 | $4,820 | $245,900 | $77,000 | $168,900 |
| 2023 | $4,820 | $228,400 | $41,500 | $186,900 |
| 2022 | $4,491 | $201,400 | $41,500 | $159,900 |
| 2021 | $3,862 | $168,700 | $41,500 | $127,200 |
| 2020 | $3,544 | $153,300 | $41,500 | $111,800 |
| 2019 | $3,251 | $139,900 | $29,800 | $110,100 |
| 2018 | $2,978 | $128,300 | $29,800 | $98,500 |
| 2017 | $2,865 | $124,600 | $29,800 | $94,800 |
| 2016 | $2,795 | $122,300 | $29,800 | $92,500 |
| 2014 | $2,471 | $114,900 | $29,800 | $85,100 |
| 2013 | $2,471 | $109,600 | $29,800 | $79,800 |
S
Landlord's Agent in 2017
Shelby Farrar
Opendoor Brokerage LLC
R
Seller's Agent in 2013
Robert Kociecki
C
Buyer's Agent in 2013
Coronna Lewis
Source: MIBOR Broker Listing Cooperative®
MLS Number: MBR21504952
APN: 29-11-30-003-069.000-006
Disclaimer: Certain information contained herein is derived from information provided by parties other than Homes.com. All information provided is deemed reliable, but is not guaranteed to be accurate and should be independently verified.
![]() Based on information submitted to the MLS GRID. All data is obtained from various sources and may not have been verified by broker or MLS GRID. Supplied Open House Information is subject to change without notice. All information should be independently reviewed and verified for accuracy. Properties may or may not be listed by the office/agent presenting the information. Some IDX listings have been excluded from this website.
Based on information submitted to the MLS GRID. All data is obtained from various sources and may not have been verified by broker or MLS GRID. Supplied Open House Information is subject to change without notice. All information should be independently reviewed and verified for accuracy. Properties may or may not be listed by the office/agent presenting the information. Some IDX listings have been excluded from this website.
