1298 560th St Cherokee, IA 51012
Estimated Value: $312,000 - $390,677
3
Beds
1
Bath
2,568
Sq Ft
$131/Sq Ft
Est. Value
About This Home
This home is located at 1298 560th St, Cherokee, IA 51012 and is currently estimated at $336,419, approximately $131 per square foot. 1298 560th St is a home located in Cherokee County with nearby schools including Cherokee Elementary School, Cherokee Middle School, and Washington High School.
Ownership History
Date
Name
Owned For
Owner Type
Purchase Details
Closed on
Nov 2, 2009
Sold by
Angell Richard P and Angell Janet K
Bought by
Burch Paula
Current Estimated Value
Purchase Details
Closed on
Sep 21, 2006
Sold by
Burch Paula
Bought by
Nelson Bradley P and Rausch Christine
Home Financials for this Owner
Home Financials are based on the most recent Mortgage that was taken out on this home.
Original Mortgage
$137,750
Interest Rate
6.49%
Mortgage Type
New Conventional
Create a Home Valuation Report for This Property
The Home Valuation Report is an in-depth analysis detailing your home's value as well as a comparison with similar homes in the area
Home Values in the Area
Average Home Value in this Area
Purchase History
| Date | Buyer | Sale Price | Title Company |
|---|---|---|---|
| Burch Paula | -- | None Available | |
| Nelson Bradley P | $145,000 | None Available |
Source: Public Records
Mortgage History
| Date | Status | Borrower | Loan Amount |
|---|---|---|---|
| Previous Owner | Nelson Bradley P | $137,750 |
Source: Public Records
Tax History Compared to Growth
Tax History
| Year | Tax Paid | Tax Assessment Tax Assessment Total Assessment is a certain percentage of the fair market value that is determined by local assessors to be the total taxable value of land and additions on the property. | Land | Improvement |
|---|---|---|---|---|
| 2025 | $2,492 | $262,780 | $29,580 | $233,200 |
| 2024 | $2,492 | $239,390 | $23,240 | $216,150 |
| 2023 | $2,522 | $239,390 | $23,240 | $216,150 |
| 2022 | $2,082 | $173,850 | $18,630 | $155,220 |
| 2021 | $2,082 | $175,110 | $19,890 | $155,220 |
| 2020 | $2,560 | $216,830 | $76,360 | $140,470 |
| 2019 | $2,910 | $229,620 | $0 | $0 |
| 2018 | $2,192 | $180,552 | $0 | $0 |
| 2017 | $2,208 | $180,552 | $0 | $0 |
| 2016 | $2,164 | $180,552 | $0 | $0 |
| 2015 | $1,940 | $154,318 | $0 | $0 |
| 2014 | $1,916 | $154,318 | $0 | $0 |
Source: Public Records
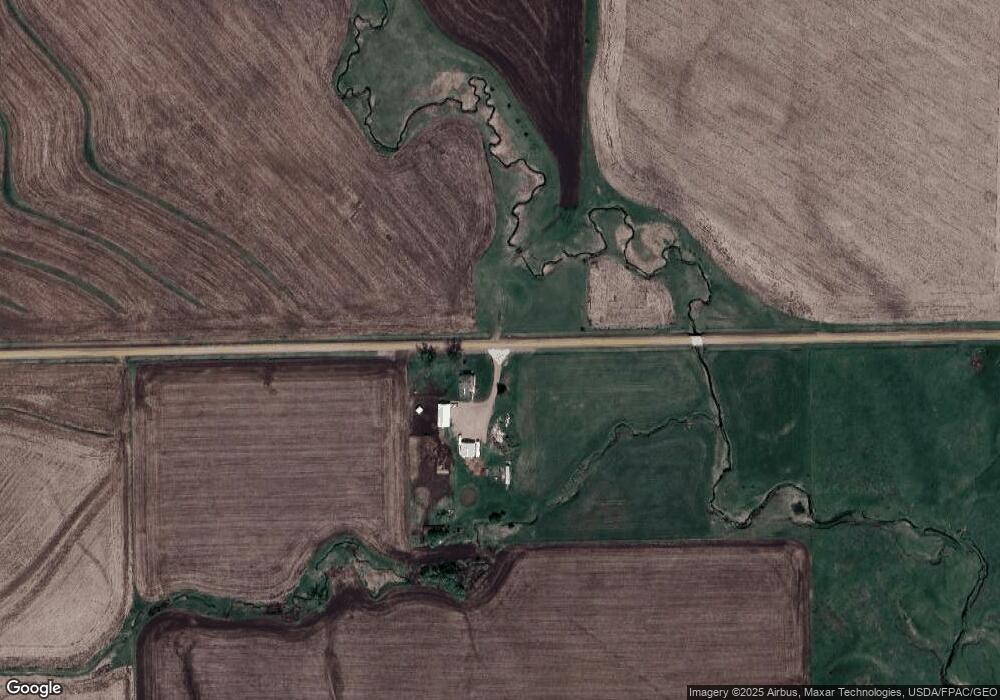
Map
Nearby Homes