
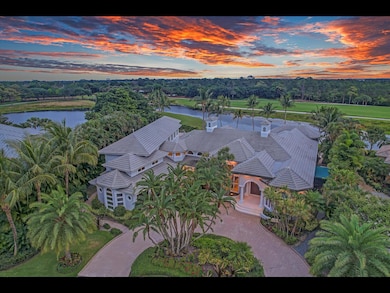
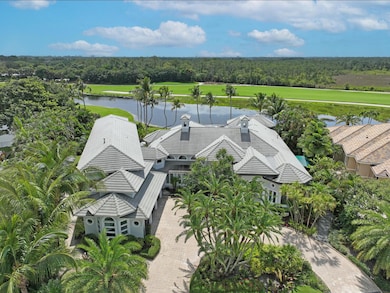
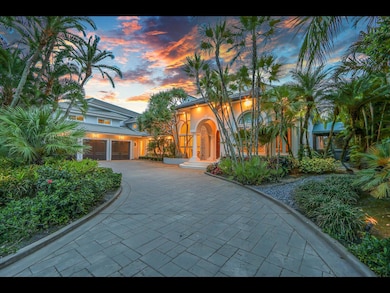
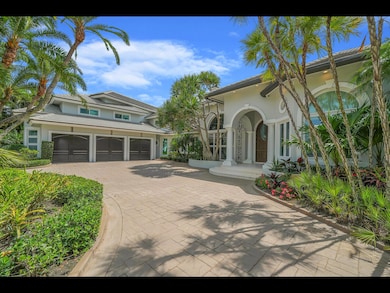
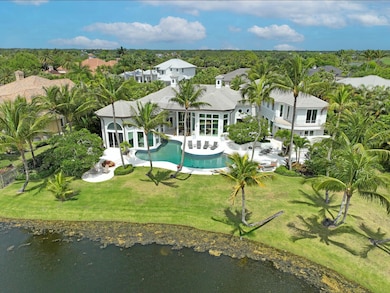
12990 Marsh Landing West Palm Beach, FL 33418
Old Marsh Golf Club NeighborhoodEstimated payment $36,664/month
Highlights
- Lake Front
- Golf Course Community
- Heated Pool
- Marsh Pointe Elementary School Rated A
- Gated with Attendant
- Fruit Trees
About This Home
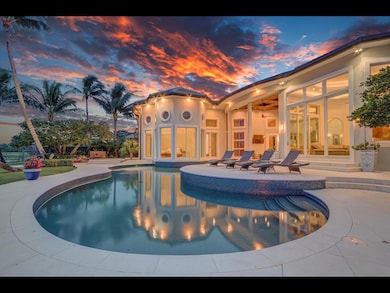
Welcome to a rare gem within the prestigious gates of Old Marsh Golf Club--an extraordinary estate that redefines refined living across more than 7,400 square feet. Designed for the discerning buyer, this custom residence offers 6 spacious bedrooms, 6 full and 2 half baths, a 3-car garage, private den, and dedicated workout room--all thoughtfully positioned to maximize privacy, flow, and luxury.Seamlessly blending indoor sophistication with outdoor serenity, the home's open-concept kitchen and great room serve as the heart of the estate, where walls of glass invite lush natural views inside. Step into your resort-style pool area from the primary suite, where spa-level indulgence meets sweeping vistas. Every detail reflects effortless elegance...
Home Details
Home Type
- Single Family
Est. Annual Taxes
- $58,529
Year Built
- Built in 1995
Lot Details
- 0.56 Acre Lot
- Lake Front
- Sprinkler System
- Fruit Trees
- Property is zoned RE
HOA Fees
- $629 Monthly HOA Fees
Parking
- 3 Car Attached Garage
- Garage Door Opener
- Circular Driveway
Property Views
- Lake
- Golf Course
- Pool
Home Design
- Concrete Roof
Interior Spaces
- 7,448 Sq Ft Home
- 2-Story Property
- Vaulted Ceiling
- Entrance Foyer
- Family Room
- Formal Dining Room
- Den
- Loft
- Attic
Kitchen
- Breakfast Area or Nook
- Gas Range
- Microwave
- Ice Maker
- Dishwasher
- Disposal
Flooring
- Wood
- Tile
Bedrooms and Bathrooms
- 6 Bedrooms | 4 Main Level Bedrooms
- Walk-In Closet
- Dual Sinks
- Separate Shower in Primary Bathroom
Laundry
- Laundry Room
- Dryer
- Washer
Outdoor Features
- Heated Pool
- Balcony
- Open Patio
- Outdoor Grill
Utilities
- Central Heating and Cooling System
- Cable TV Available
Listing and Financial Details
- Assessor Parcel Number 00424128010000370
Community Details
Overview
- Private Membership Available
- Old Marsh Subdivision
Amenities
- Clubhouse
Recreation
- Golf Course Community
Security
- Gated with Attendant
- Resident Manager or Management On Site
Map
Home Values in the Area
Average Home Value in this Area
Tax History
| Year | Tax Paid | Tax Assessment Tax Assessment Total Assessment is a certain percentage of the fair market value that is determined by local assessors to be the total taxable value of land and additions on the property. | Land | Improvement |
|---|---|---|---|---|
| 2024 | $58,529 | $3,141,403 | -- | -- |
| 2023 | $55,814 | $2,855,821 | $1,775,150 | $1,951,966 |
| 2022 | $47,200 | $2,596,201 | $0 | $0 |
| 2021 | $42,769 | $2,360,183 | $610,000 | $1,750,183 |
| 2020 | $40,499 | $2,253,811 | $585,000 | $1,668,811 |
| 2019 | $37,287 | $1,978,542 | $535,000 | $1,443,542 |
| 2018 | $35,907 | $1,969,375 | $502,924 | $1,466,451 |
| 2017 | $34,598 | $1,875,810 | $513,188 | $1,362,622 |
| 2016 | $32,868 | $1,738,347 | $0 | $0 |
| 2015 | $35,979 | $1,834,736 | $0 | $0 |
| 2014 | $32,933 | $1,667,942 | $0 | $0 |
Property History
| Date | Event | Price | List to Sale | Price per Sq Ft |
|---|---|---|---|---|
| 06/11/2025 06/11/25 | For Sale | $5,900,000 | -- | $792 / Sq Ft |
Purchase History
| Date | Type | Sale Price | Title Company |
|---|---|---|---|
| Quit Claim Deed | -- | None Listed On Document | |
| Warranty Deed | $1,400,000 | Attorney | |
| Warranty Deed | $2,700,000 | -- | |
| Warranty Deed | -- | -- |
Mortgage History
| Date | Status | Loan Amount | Loan Type |
|---|---|---|---|
| Previous Owner | $417,000 | New Conventional |
Source: BeachesMLS
MLS Number: R11098542
APN: 00-42-41-28-01-000-0370
Disclaimer: Certain information contained herein is derived from information provided by parties other than Homes.com. All information provided is deemed reliable, but is not guaranteed to be accurate and should be independently verified.
![]() IDX information is provided exclusively for personal, non-commercial use, and may not be used for any purpose other than to identify prospective properties consumers may be interested in purchasing. Information is deemed reliable but not guaranteed.
IDX information is provided exclusively for personal, non-commercial use, and may not be used for any purpose other than to identify prospective properties consumers may be interested in purchasing. Information is deemed reliable but not guaranteed.
- 12961 Marsh Landing
- 12901 Marsh Landing
- 7500 Marsh Cove
- 6928 Briarlake Cir Unit L102
- 199 Sedona Way
- 6944 Briarlake Cir Unit 203
- 6944 Briarlake Cir Unit 205
- 6861 Briarlake Cir
- 12829 Briarlake Dr Unit I102
- 12829 Briarlake Dr Unit I204
- 12870 Briarlake 201 Dr Unit 201
- 113 La Vida Ct
- 6746 Touchstone Cir
- 13210 Touchstone Place
- 12870 Briarlake Dr Unit 106
- 12870 Briarlake Dr Unit 104
- 150 Sedona Way
- 13258 Touchstone Place
- 13403 Touchstone Place Unit A102
- 13001 Brynwood
- 193 Sedona Way
- 195 Sedona Way
- 6928 Briarlake Cir Unit L202
- 6878 Touchstone Cir
- 6854 Touchstone Cir
- 12790 Briarlake 103 Dr Unit 103
- 13186 Touchstone Place
- 13312 Touchstone Place
- 12932 Touchstone Place
- 13335 Cross Pointe Dr
- 13197 Sand Grouse Ct
- 13692 Crosspointe Dr
- 6598 Eastpointe Pines St
- 12751 Touchstone Place
- 183 Isle Verde Way
- 154 Isle Verde Way
- 6204 Celadon Cir
- 138 Tranquilla Dr
- 13772 Sand Crane Dr
- 6198 Brandon St
