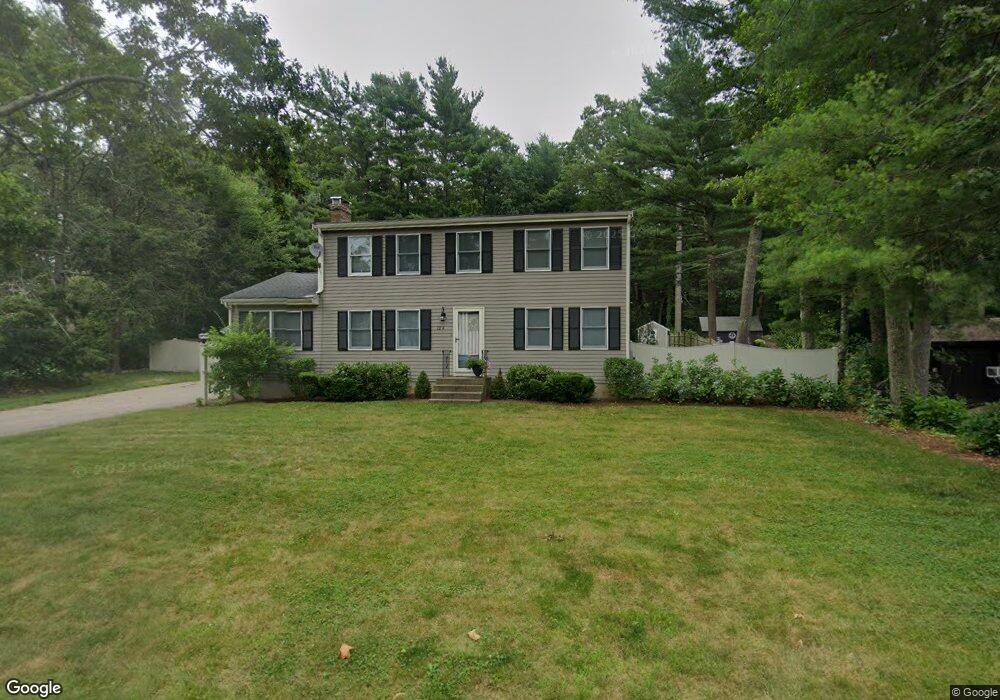
12A Lakeview Rd Foxboro, MA 02035
Estimated Value: $659,000 - $752,000
2
Beds
3
Baths
1,968
Sq Ft
$352/Sq Ft
Est. Value
About This Home
This home is located at 12A Lakeview Rd, Foxboro, MA 02035 and is currently estimated at $692,170, approximately $351 per square foot. 12A Lakeview Rd is a home located in Norfolk County with nearby schools including Foxborough High School, Foxborough Regional Charter School, and The Sage School.
Ownership History
Date
Name
Owned For
Owner Type
Purchase Details
Closed on
Mar 24, 2015
Sold by
Morse Anne L
Bought by
Morse Ret
Current Estimated Value
Purchase Details
Closed on
May 14, 1993
Sold by
Walsh Richard T and Walsh Phyllis I
Bought by
Morse Gregory E and Morse Anne L
Create a Home Valuation Report for This Property
The Home Valuation Report is an in-depth analysis detailing your home's value as well as a comparison with similar homes in the area
Home Values in the Area
Average Home Value in this Area
Purchase History
| Date | Buyer | Sale Price | Title Company |
|---|---|---|---|
| Morse Ret | -- | -- | |
| Morse Gregory E | $140,000 | -- |
Source: Public Records
Mortgage History
| Date | Status | Borrower | Loan Amount |
|---|---|---|---|
| Previous Owner | Morse Gregory E | $25,000 | |
| Previous Owner | Morse Gregory E | $222,000 | |
| Previous Owner | Morse Gregory E | $55,800 | |
| Previous Owner | Morse Gregory E | $18,000 |
Source: Public Records
Tax History Compared to Growth
Tax History
| Year | Tax Paid | Tax Assessment Tax Assessment Total Assessment is a certain percentage of the fair market value that is determined by local assessors to be the total taxable value of land and additions on the property. | Land | Improvement |
|---|---|---|---|---|
| 2025 | $7,703 | $582,700 | $217,400 | $365,300 |
| 2024 | $7,172 | $530,900 | $217,400 | $313,500 |
| 2023 | $6,996 | $492,300 | $207,000 | $285,300 |
| 2022 | $6,846 | $471,500 | $198,000 | $273,500 |
| 2021 | $6,489 | $440,200 | $180,000 | $260,200 |
| 2020 | $6,291 | $431,800 | $180,000 | $251,800 |
| 2019 | $5,974 | $406,400 | $171,400 | $235,000 |
| 2018 | $5,829 | $400,100 | $171,400 | $228,700 |
| 2017 | $5,623 | $373,900 | $160,200 | $213,700 |
| 2016 | $5,485 | $370,100 | $154,100 | $216,000 |
| 2015 | $5,420 | $356,800 | $130,200 | $226,600 |
| 2014 | $5,247 | $350,000 | $127,600 | $222,400 |
Source: Public Records
Map
Nearby Homes
- 11 Goodwin Dr
- 131 Washington St Unit 42
- 11 Orchard Place Unit 11
- 14 Baker St
- 14 Foxhill Rd
- 24 Mechanic St
- 25 Foxboro Rd
- 73 Ridge Rd
- 1 Eisenhauer Ln
- 35 Shoreline Dr
- 65 Pond St
- 84 Cocasset St Unit A6
- 7 Hill St Unit 10
- 80 Mill St
- 2 Thompson Rd
- 14 Winter St Unit B
- 11 W Belcher Rd Unit 2
- 18 Winter St Unit E
- 137 Beach St
- 186 Mechanic St