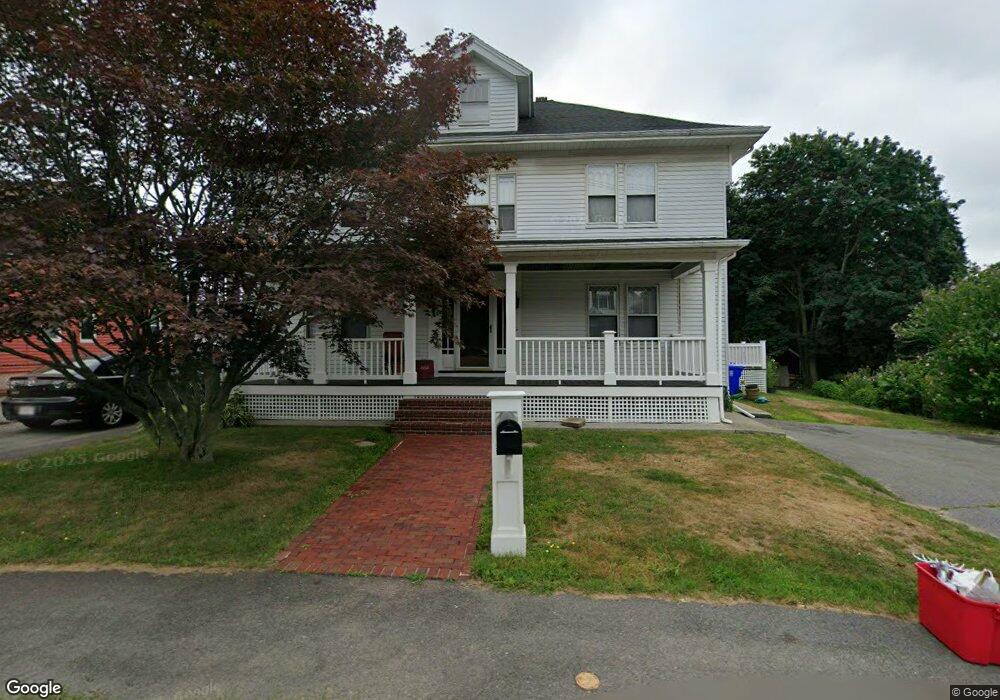
12B Pratt St Taunton, MA 02780
Weir Village NeighborhoodEstimated Value: $518,000 - $549,000
4
Beds
2
Baths
2,444
Sq Ft
$218/Sq Ft
Est. Value
About This Home
This home is located at 12B Pratt St, Taunton, MA 02780 and is currently estimated at $531,947, approximately $217 per square foot. 12B Pratt St is a home located in Bristol County with nearby schools including East Taunton Elementary School, Taunton High School, and Our Lady of Lourdes School.
Ownership History
Date
Name
Owned For
Owner Type
Purchase Details
Closed on
Jul 31, 1998
Sold by
Lebrun Daniel M and Lebrun Linda J
Bought by
Dias Fernando M and Dias Michele
Current Estimated Value
Home Financials for this Owner
Home Financials are based on the most recent Mortgage that was taken out on this home.
Original Mortgage
$126,000
Outstanding Balance
$26,286
Interest Rate
6.92%
Mortgage Type
Purchase Money Mortgage
Estimated Equity
$505,661
Create a Home Valuation Report for This Property
The Home Valuation Report is an in-depth analysis detailing your home's value as well as a comparison with similar homes in the area
Home Values in the Area
Average Home Value in this Area
Purchase History
| Date | Buyer | Sale Price | Title Company |
|---|---|---|---|
| Dias Fernando M | $129,940 | -- |
Source: Public Records
Mortgage History
| Date | Status | Borrower | Loan Amount |
|---|---|---|---|
| Open | Dias Fernando M | $126,000 |
Source: Public Records
Tax History Compared to Growth
Tax History
| Year | Tax Paid | Tax Assessment Tax Assessment Total Assessment is a certain percentage of the fair market value that is determined by local assessors to be the total taxable value of land and additions on the property. | Land | Improvement |
|---|---|---|---|---|
| 2025 | $4,692 | $428,900 | $115,500 | $313,400 |
| 2024 | $4,337 | $387,600 | $115,500 | $272,100 |
| 2023 | $4,313 | $357,900 | $115,500 | $242,400 |
| 2022 | $4,096 | $310,800 | $96,300 | $214,500 |
| 2021 | $3,999 | $281,600 | $87,500 | $194,100 |
| 2020 | $3,963 | $266,700 | $87,500 | $179,200 |
| 2019 | $3,765 | $238,900 | $87,500 | $151,400 |
| 2018 | $3,748 | $238,400 | $88,400 | $150,000 |
| 2017 | $3,346 | $213,000 | $83,800 | $129,200 |
| 2016 | $3,244 | $206,900 | $81,400 | $125,500 |
| 2015 | $3,167 | $211,000 | $79,300 | $131,700 |
| 2014 | $3,128 | $214,100 | $79,300 | $134,800 |
Source: Public Records
Map
Nearby Homes
- 8 Herbert St
- 11 Talbot Ave
- 41 Hart Ave
- 195 Pratt St Unit A
- 70 Landing Dr Unit 5-L
- 1 Fayal Ave
- 6 Southeast St
- 29 Williams Ave
- 90 E Water St
- 71 Linden St
- 1301 Carriage Ln Unit 1301
- 450 Somerset Ave Unit 2-7
- 450 Somerset Ave Unit 6-6
- 24 1st St
- 4 Parkin Ct
- 252 Somerset Ave
- 3 Karena Dr Unit 8
- 25 Johnson St Unit B
- 23 Johnson St Unit C
- 600 County St