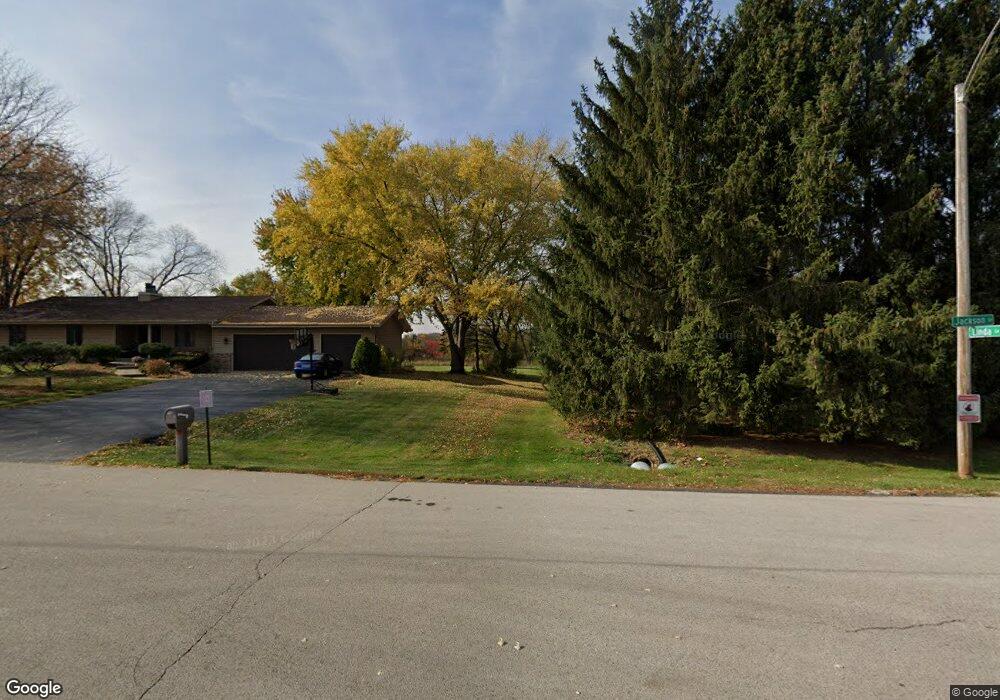
12N346 Jackson Dr Unit 2 Elgin, IL 60124
Far West Elgin NeighborhoodEstimated Value: $440,000 - $529,000
3
Beds
4
Baths
2,027
Sq Ft
$237/Sq Ft
Est. Value
About This Home
This home is located at 12N346 Jackson Dr Unit 2, Elgin, IL 60124 and is currently estimated at $481,142, approximately $237 per square foot. 12N346 Jackson Dr Unit 2 is a home located in Kane County with nearby schools including Country Trails Elementary School, Prairie Knolls Middle School, and Central Middle School.
Ownership History
Date
Name
Owned For
Owner Type
Purchase Details
Closed on
Jul 25, 2017
Sold by
Hambrock Sharon Ann
Bought by
Carey Adam R and Carey Holly M
Current Estimated Value
Home Financials for this Owner
Home Financials are based on the most recent Mortgage that was taken out on this home.
Original Mortgage
$274,170
Interest Rate
5.25%
Mortgage Type
FHA
Purchase Details
Closed on
Jul 2, 2015
Sold by
Hambrock Sharon A and Stevens Joy A
Bought by
Hambrock Sharon Ann
Purchase Details
Closed on
Aug 31, 2005
Sold by
Hambrock Sharon A and Hambrock Thad L
Bought by
Hambrock Sharon Ann and Stevens Joy Ann
Purchase Details
Closed on
Aug 24, 1998
Sold by
Hurley Eugene W and Hurley Lynne M
Bought by
Parrish Gregory F and Perrish Connie L
Home Financials for this Owner
Home Financials are based on the most recent Mortgage that was taken out on this home.
Original Mortgage
$160,000
Interest Rate
7%
Create a Home Valuation Report for This Property
The Home Valuation Report is an in-depth analysis detailing your home's value as well as a comparison with similar homes in the area
Home Values in the Area
Average Home Value in this Area
Purchase History
| Date | Buyer | Sale Price | Title Company |
|---|---|---|---|
| Carey Adam R | $225,000 | Citywide Title Corp | |
| Hambrock Sharon Ann | -- | None Available | |
| Hambrock Sharon Ann | -- | -- | |
| Parrish Gregory F | $257,000 | -- |
Source: Public Records
Mortgage History
| Date | Status | Borrower | Loan Amount |
|---|---|---|---|
| Previous Owner | Carey Adam R | $274,170 | |
| Previous Owner | Parrish Gregory F | $160,000 |
Source: Public Records
Tax History
| Year | Tax Paid | Tax Assessment Tax Assessment Total Assessment is a certain percentage of the fair market value that is determined by local assessors to be the total taxable value of land and additions on the property. | Land | Improvement |
|---|---|---|---|---|
| 2024 | $11,036 | $146,624 | $34,085 | $112,539 |
| 2023 | $10,545 | $132,463 | $30,793 | $101,670 |
| 2022 | $10,007 | $120,783 | $28,078 | $92,705 |
| 2021 | $9,551 | $112,924 | $26,251 | $86,673 |
| 2020 | $9,239 | $107,804 | $25,061 | $82,743 |
| 2019 | $8,877 | $102,690 | $23,872 | $78,818 |
| 2018 | $8,310 | $96,741 | $22,489 | $74,252 |
| 2017 | $7,463 | $91,455 | $21,260 | $70,195 |
| 2016 | $7,432 | $84,846 | $19,724 | $65,122 |
| 2015 | -- | $77,769 | $18,079 | $59,690 |
| 2014 | -- | $76,809 | $17,856 | $58,953 |
| 2013 | -- | $78,835 | $18,327 | $60,508 |
Source: Public Records
Map
Nearby Homes
- 11N958 Almora Terrace
- 2936 Avalon Dr
- 2843 Winchester Dr
- 2830 Colonial Dr
- Lot 1 Highland Springs Dr
- 640 Highland Springs Dr
- 2829 Randall Ridge Dr
- 3374 Cameron Dr Unit 144
- 2705 Colonial Dr
- 436 W Amberside Dr
- 3032 Long Common Pkwy
- 532 Shenandoah Trail
- 40 Acres Randall Rd
- 2205 Country Knoll Ln
- 2176 Jordan Ln
- 2022 Torino Dr
- 512 Shenandoah Trail
- 356 N Airlite St Unit 356
- 3056 Mosedale St
- 218 Middleton Ct
- 12N346 Jackson Dr
- 12N320 Jackson Dr
- 12N376 Jackson Dr
- 12N290 Jackson Dr
- 37W435 Linda Ln
- 12N295 Jackson Dr
- 12N402 Jackson Dr
- 12N385 Jackson Dr
- 12N268 Jackson Dr
- 12N271 Jackson Dr
- 12N422 Jackson Dr
- 37W390 Linda Ln
- 12N425 Jackson Dr
- 12N300 Charlotte Ct
- Lot 2 Linda Ln
- 37W453 Elmer Ct
- 37W468 Elmer Ct
- 37W360 Linda Ln
- 12N260 Charlotte Ct
- 12N455 Jackson Dr
Your Personal Tour Guide
Ask me questions while you tour the home.