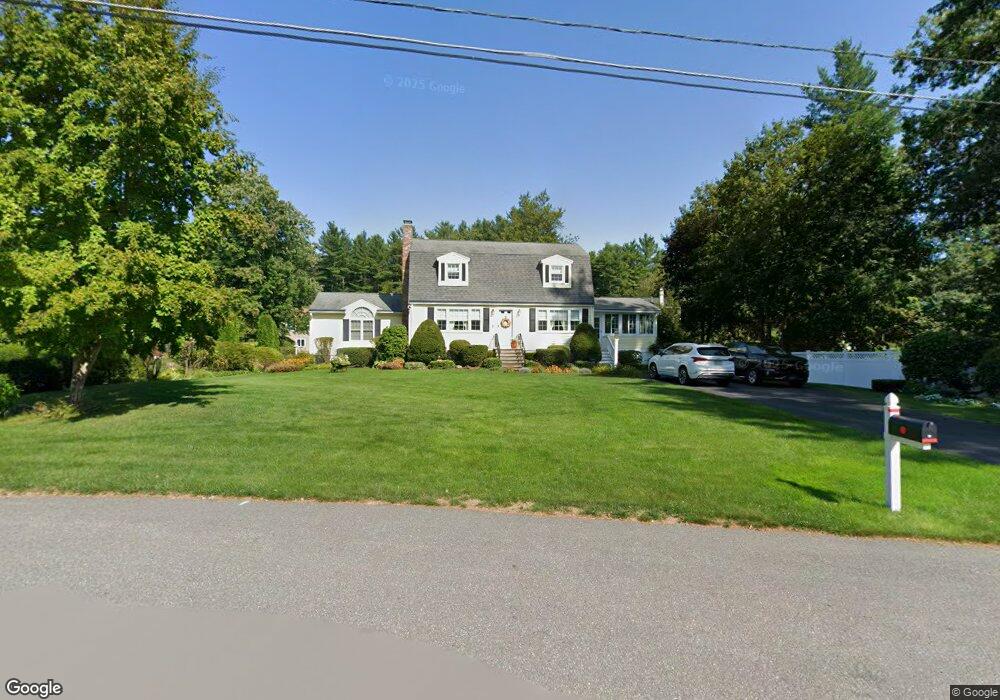
13 Algonquin Rd Pepperell, MA 01463
Estimated Value: $567,000 - $622,000
3
Beds
3
Baths
2,374
Sq Ft
$254/Sq Ft
Est. Value
About This Home
This home is located at 13 Algonquin Rd, Pepperell, MA 01463 and is currently estimated at $603,277, approximately $254 per square foot. 13 Algonquin Rd is a home located in Middlesex County with nearby schools including North Middlesex Regional High School, Pepperell Christian Academy, and Maple Dene & Moppet School.
Ownership History
Date
Name
Owned For
Owner Type
Purchase Details
Closed on
May 3, 2017
Sold by
Dell-Isola Joseph E and Dell-Isola Patricie M
Bought by
Dell Isola Nt
Current Estimated Value
Purchase Details
Closed on
Feb 6, 1963
Bought by
Dellisola Joseph E and Dellisola Patricia
Create a Home Valuation Report for This Property
The Home Valuation Report is an in-depth analysis detailing your home's value as well as a comparison with similar homes in the area
Home Values in the Area
Average Home Value in this Area
Purchase History
| Date | Buyer | Sale Price | Title Company |
|---|---|---|---|
| Dell Isola Nt | -- | -- | |
| Dellisola Joseph E | -- | -- |
Source: Public Records
Mortgage History
| Date | Status | Borrower | Loan Amount |
|---|---|---|---|
| Previous Owner | Dellisola Joseph E | $14,961 | |
| Previous Owner | Dellisola Joseph E | $78,000 | |
| Previous Owner | Dellisola Joseph E | $88,000 |
Source: Public Records
Tax History Compared to Growth
Tax History
| Year | Tax Paid | Tax Assessment Tax Assessment Total Assessment is a certain percentage of the fair market value that is determined by local assessors to be the total taxable value of land and additions on the property. | Land | Improvement |
|---|---|---|---|---|
| 2025 | $7,593 | $519,000 | $139,600 | $379,400 |
| 2024 | $6,944 | $483,900 | $127,400 | $356,500 |
| 2023 | $6,338 | $418,600 | $115,300 | $303,300 |
| 2022 | $6,292 | $366,900 | $103,200 | $263,700 |
| 2021 | $6,055 | $337,900 | $91,000 | $246,900 |
| 2020 | $5,811 | $342,200 | $91,000 | $251,200 |
| 2019 | $5,241 | $315,900 | $91,000 | $224,900 |
| 2018 | $4,961 | $302,700 | $91,000 | $211,700 |
| 2017 | $4,648 | $292,500 | $91,000 | $201,500 |
| 2016 | $4,526 | $273,800 | $91,000 | $182,800 |
| 2015 | $4,367 | $273,800 | $91,000 | $182,800 |
| 2014 | $4,184 | $263,800 | $85,000 | $178,800 |
Source: Public Records
Map
Nearby Homes
- 2 Old Farm Ln
- 13 Oak Hill St
- 179 Brookline St
- 10 Boynton St
- 55 Park St
- 16 Village Rd
- 143 Worcester Rd
- 31 Heald St
- 18 Maple St Unit 30
- 8 Tucker Park Unit D
- 10 Tucker St
- 84 Irene Dr
- 80A Nashua Rd
- 21 Cranberry St
- 102A Nashua Rd
- 29 Southgate Rd
- 24-A 34-A Dow St
- 6 High Oaks Path
- 28-30 Groton St
- 4-58 Dow Rd