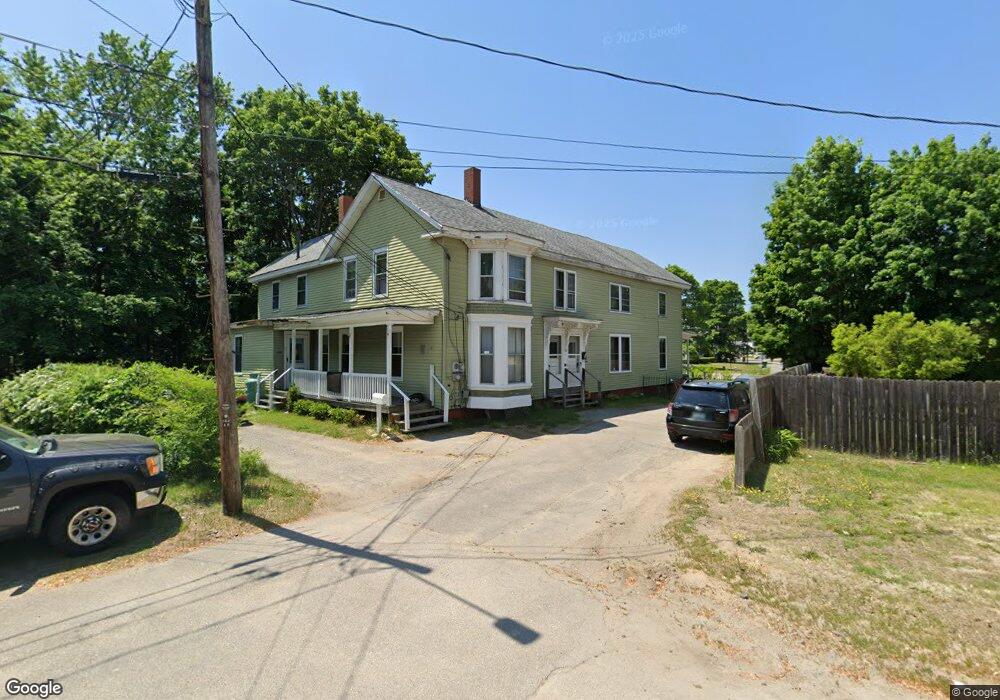
13 Blake St Rochester, NH 03867
Estimated Value: $430,336 - $573,000
7
Beds
3
Baths
3,314
Sq Ft
$146/Sq Ft
Est. Value
About This Home
This home is located at 13 Blake St, Rochester, NH 03867 and is currently estimated at $484,834, approximately $146 per square foot. 13 Blake St is a home with nearby schools including William Allen School, Rochester Middle School, and Spaulding High School.
Ownership History
Date
Name
Owned For
Owner Type
Purchase Details
Closed on
Aug 1, 2005
Sold by
Jin Yongjiang
Bought by
Ellis Christopher J
Current Estimated Value
Home Financials for this Owner
Home Financials are based on the most recent Mortgage that was taken out on this home.
Original Mortgage
$233,910
Outstanding Balance
$121,407
Interest Rate
5.67%
Mortgage Type
Purchase Money Mortgage
Estimated Equity
$363,427
Purchase Details
Closed on
Sep 30, 1999
Sold by
Guy Frank C and Guy James W
Bought by
Wang Hua
Home Financials for this Owner
Home Financials are based on the most recent Mortgage that was taken out on this home.
Original Mortgage
$90,000
Interest Rate
7.85%
Mortgage Type
Purchase Money Mortgage
Create a Home Valuation Report for This Property
The Home Valuation Report is an in-depth analysis detailing your home's value as well as a comparison with similar homes in the area
Home Values in the Area
Average Home Value in this Area
Purchase History
| Date | Buyer | Sale Price | Title Company |
|---|---|---|---|
| Ellis Christopher J | $259,900 | -- | |
| Wang Hua | $100,000 | -- | |
| Wang Hua | $100,000 | -- |
Source: Public Records
Mortgage History
| Date | Status | Borrower | Loan Amount |
|---|---|---|---|
| Open | Wang Hua | $233,910 | |
| Previous Owner | Wang Hua | $90,000 |
Source: Public Records
Tax History Compared to Growth
Tax History
| Year | Tax Paid | Tax Assessment Tax Assessment Total Assessment is a certain percentage of the fair market value that is determined by local assessors to be the total taxable value of land and additions on the property. | Land | Improvement |
|---|---|---|---|---|
| 2024 | $5,740 | $386,500 | $73,100 | $313,400 |
| 2023 | $5,701 | $221,500 | $39,100 | $182,400 |
| 2022 | $5,600 | $221,500 | $39,100 | $182,400 |
| 2021 | $5,460 | $221,500 | $39,100 | $182,400 |
| 2020 | $5,451 | $221,500 | $39,100 | $182,400 |
| 2019 | $5,515 | $221,500 | $39,100 | $182,400 |
| 2018 | $4,709 | $171,100 | $34,800 | $136,300 |
| 2017 | $4,505 | $171,100 | $34,800 | $136,300 |
| 2016 | $3,798 | $134,400 | $34,800 | $99,600 |
| 2015 | $3,783 | $134,400 | $34,800 | $99,600 |
| 2014 | $3,692 | $134,400 | $34,800 | $99,600 |
| 2013 | $3,867 | $146,700 | $47,800 | $98,900 |
| 2012 | $3,767 | $146,700 | $47,800 | $98,900 |
Source: Public Records
Map
Nearby Homes