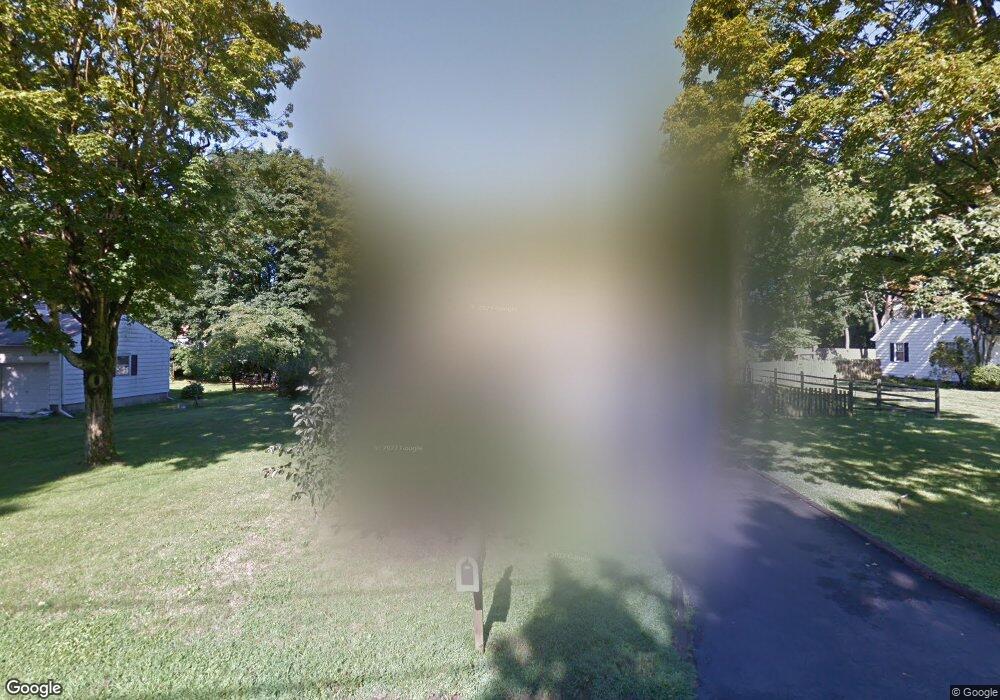
13 Bolfmar Ave Princeton Junction, NJ 08550
Estimated Value: $656,727 - $732,000
Studio
--
Bath
1,649
Sq Ft
$413/Sq Ft
Est. Value
About This Home
This home is located at 13 Bolfmar Ave, Princeton Junction, NJ 08550 and is currently estimated at $681,432, approximately $413 per square foot. 13 Bolfmar Ave is a home located in Mercer County with nearby schools including Maurice Hawk Elementary School, Millstone River School, and Community Middle School.
Ownership History
Date
Name
Owned For
Owner Type
Purchase Details
Closed on
Mar 1, 2024
Sold by
Osborn Katharine
Bought by
Katharine Osborn Kosa Agreement Of Trust and Kosa
Current Estimated Value
Purchase Details
Closed on
Sep 9, 2005
Sold by
Osborn Charles
Bought by
Osborn Katharine and Osborn David
Home Financials for this Owner
Home Financials are based on the most recent Mortgage that was taken out on this home.
Original Mortgage
$185,000
Interest Rate
5.92%
Create a Home Valuation Report for This Property
The Home Valuation Report is an in-depth analysis detailing your home's value as well as a comparison with similar homes in the area
Home Values in the Area
Average Home Value in this Area
Purchase History
| Date | Buyer | Sale Price | Title Company |
|---|---|---|---|
| Katharine Osborn Kosa Agreement Of Trust | -- | None Listed On Document | |
| Katharine Osborn Kosa Agreement Of Trust | -- | None Listed On Document | |
| Osborn Katharine | $380,000 | -- |
Source: Public Records
Mortgage History
| Date | Status | Borrower | Loan Amount |
|---|---|---|---|
| Previous Owner | Osborn Katharine | $185,000 |
Source: Public Records
Tax History
| Year | Tax Paid | Tax Assessment Tax Assessment Total Assessment is a certain percentage of the fair market value that is determined by local assessors to be the total taxable value of land and additions on the property. | Land | Improvement |
|---|---|---|---|---|
| 2025 | $12,235 | $399,200 | $257,000 | $142,200 |
| 2024 | $11,725 | $399,200 | $257,000 | $142,200 |
Source: Public Records
Map
Nearby Homes
- 12 Berkshire Dr
- 12 Corio Ct
- 7 Camas Ct
- 11 Harvest Dr
- 2 Colonial Ct
- 2902 Justin Dr
- 1402 Justin Dr Unit 1403
- 3102 Justin Dr
- 2904 Justin Dr Unit 2903
- 1402 Justin Dr
- 2902 Justin Dr Unit 2905
- 3102 Justin Dr Unit 3104
- 3103 Justin Dr
- 2904 Justin Dr
- 1503 Justin Dr
- 71 Riverwalk
- 45 Riverwalk
- 34 Riverwalk
- 103 Harris Rd
- 1802 American Place
Your Personal Tour Guide
Ask me questions while you tour the home.