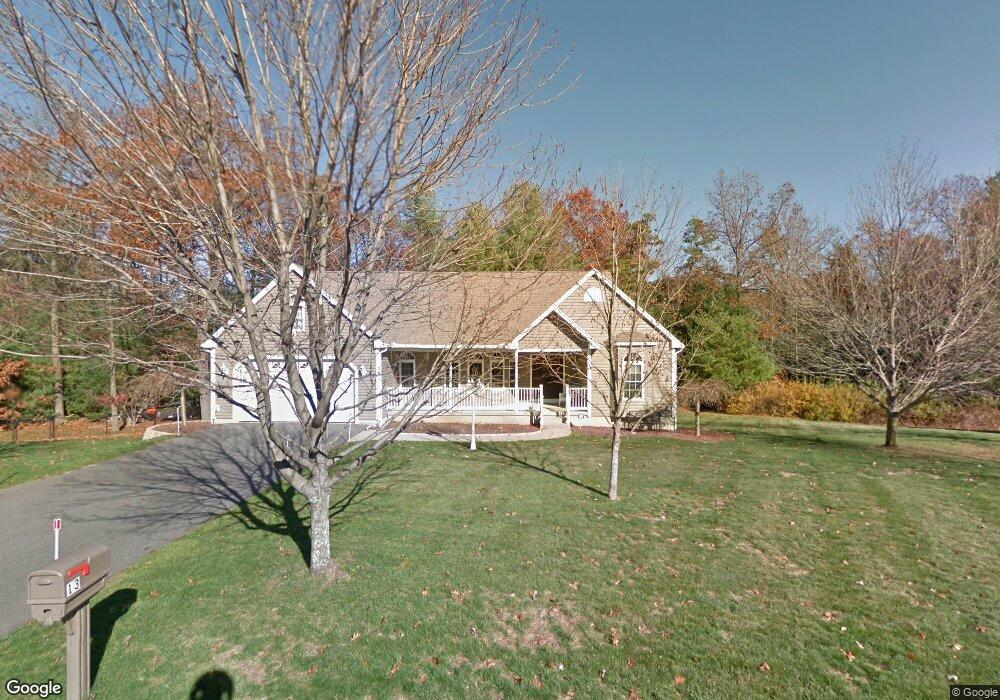
13 Camelot Ln Easthampton, MA 01027
Estimated Value: $563,000 - $662,000
3
Beds
3
Baths
2,040
Sq Ft
$300/Sq Ft
Est. Value
About This Home
This home is located at 13 Camelot Ln, Easthampton, MA 01027 and is currently estimated at $612,083, approximately $300 per square foot. 13 Camelot Ln is a home located in Hampshire County with nearby schools including Easthampton High School, Calvary Baptist Christian School, and Tri-County Schools.
Ownership History
Date
Name
Owned For
Owner Type
Purchase Details
Closed on
Oct 18, 2010
Sold by
Carotenuto Richard P and Carotenuto Christine
Bought by
Carotenuto Richard P and Pagliuca Angela
Current Estimated Value
Purchase Details
Closed on
Dec 5, 2002
Sold by
Czelusniak Custom Home
Bought by
Carotenuto Christine and Carotenuto Richard P
Home Financials for this Owner
Home Financials are based on the most recent Mortgage that was taken out on this home.
Original Mortgage
$50,000
Interest Rate
6.34%
Mortgage Type
Purchase Money Mortgage
Create a Home Valuation Report for This Property
The Home Valuation Report is an in-depth analysis detailing your home's value as well as a comparison with similar homes in the area
Home Values in the Area
Average Home Value in this Area
Purchase History
| Date | Buyer | Sale Price | Title Company |
|---|---|---|---|
| Carotenuto Richard P | -- | -- | |
| Carotenuto Christine | $221,000 | -- |
Source: Public Records
Mortgage History
| Date | Status | Borrower | Loan Amount |
|---|---|---|---|
| Previous Owner | Carotenuto Christine | $50,000 |
Source: Public Records
Tax History Compared to Growth
Tax History
| Year | Tax Paid | Tax Assessment Tax Assessment Total Assessment is a certain percentage of the fair market value that is determined by local assessors to be the total taxable value of land and additions on the property. | Land | Improvement |
|---|---|---|---|---|
| 2025 | $7,456 | $545,400 | $125,800 | $419,600 |
| 2024 | $7,202 | $531,100 | $122,300 | $408,800 |
| 2023 | $5,336 | $364,200 | $96,200 | $268,000 |
| 2022 | $6,020 | $364,200 | $96,200 | $268,000 |
| 2021 | $6,627 | $377,800 | $96,200 | $281,600 |
| 2020 | $6,468 | $364,200 | $96,200 | $268,000 |
| 2019 | $5,380 | $348,000 | $96,200 | $251,800 |
| 2018 | $5,131 | $320,700 | $90,600 | $230,100 |
| 2017 | $5,011 | $309,100 | $87,100 | $222,000 |
| 2016 | $5,012 | $321,500 | $87,100 | $234,400 |
| 2015 | $4,871 | $321,500 | $87,100 | $234,400 |
Source: Public Records
Map
Nearby Homes