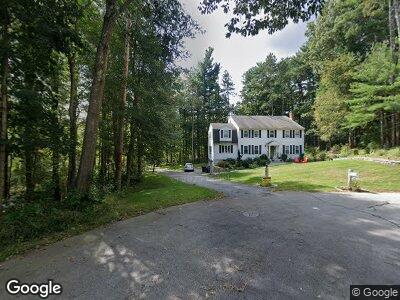
13 Cardinal Ln Andover, MA 01810
Ballardvale NeighborhoodEstimated Value: $978,342 - $1,128,000
4
Beds
3
Baths
3,044
Sq Ft
$341/Sq Ft
Est. Value
About This Home
This home is located at 13 Cardinal Ln, Andover, MA 01810 and is currently estimated at $1,038,586, approximately $341 per square foot. 13 Cardinal Ln is a home located in Essex County with nearby schools including Henry C. Sanborn Elementary School, Andover West Middle School, and Andover High School.
Ownership History
Date
Name
Owned For
Owner Type
Purchase Details
Closed on
Jun 11, 2020
Sold by
Ferreira Cardinal T and Ferreira F
Bought by
Ferreira Silvino and Ferreira Dawn L
Current Estimated Value
Purchase Details
Closed on
Apr 27, 2019
Sold by
Ferreira Silvino M and Ferreira Dawn L
Bought by
Ferreira Cardinal T and Ferreira F
Purchase Details
Closed on
Sep 1, 2006
Sold by
Salerno Frances C
Bought by
Ferreira Dawn L and Ryan Dawn L
Home Financials for this Owner
Home Financials are based on the most recent Mortgage that was taken out on this home.
Original Mortgage
$395,000
Interest Rate
6.83%
Mortgage Type
Purchase Money Mortgage
Create a Home Valuation Report for This Property
The Home Valuation Report is an in-depth analysis detailing your home's value as well as a comparison with similar homes in the area
Home Values in the Area
Average Home Value in this Area
Purchase History
| Date | Buyer | Sale Price | Title Company |
|---|---|---|---|
| Ferreira Silvino | -- | None Available | |
| Ferreira Silvino | -- | None Available | |
| Ferreira Cardinal T | -- | -- | |
| Ferreira Cardinal T | -- | -- | |
| Ferreira Dawn L | $540,000 | -- | |
| Ferreira Dawn L | $540,000 | -- |
Source: Public Records
Mortgage History
| Date | Status | Borrower | Loan Amount |
|---|---|---|---|
| Open | Ferreira Silvino M | $150,000 | |
| Closed | Ferreira Silvino M | $100,000 | |
| Previous Owner | Ferreira Dawn L | $46,800 | |
| Previous Owner | Salerno James | $392,000 | |
| Previous Owner | Salerno James | $399,200 | |
| Previous Owner | Ferreira Dawn L | $395,000 | |
| Previous Owner | Salerno Frances C | $120,000 |
Source: Public Records
Tax History Compared to Growth
Tax History
| Year | Tax Paid | Tax Assessment Tax Assessment Total Assessment is a certain percentage of the fair market value that is determined by local assessors to be the total taxable value of land and additions on the property. | Land | Improvement |
|---|---|---|---|---|
| 2024 | $10,759 | $835,300 | $420,000 | $415,300 |
| 2023 | $10,016 | $733,200 | $359,200 | $374,000 |
| 2022 | $9,607 | $658,000 | $323,700 | $334,300 |
| 2021 | $9,224 | $603,300 | $294,400 | $308,900 |
| 2020 | $8,989 | $598,900 | $294,400 | $304,500 |
| 2019 | $9,080 | $594,600 | $294,400 | $300,200 |
| 2018 | $8,807 | $563,100 | $285,900 | $277,200 |
| 2017 | $8,452 | $556,800 | $280,200 | $276,600 |
| 2016 | $8,284 | $559,000 | $280,200 | $278,800 |
| 2015 | $8,154 | $544,700 | $280,200 | $264,500 |
Source: Public Records
Map
Nearby Homes
- 72 Tewksbury St
- 25 Jills Way
- 76 Dascomb Rd
- 60 Lowell Junction Rd
- 7 Bradley Rd
- 40 Bradford Rd
- 18 Dale St Unit 6G
- 19 Kensington Way Unit 54
- 12 Alonesos Way
- 63 Andover St
- 120 Jennies Way
- 19 Blood Rd
- 91 Bligh St
- 1 Delisio Dr
- 17 Enfield Dr
- 50 Starr Ave
- 124 Lovejoy Rd
- 347 Lowell St
- 1143 South St
- 87 Ballardvale Rd