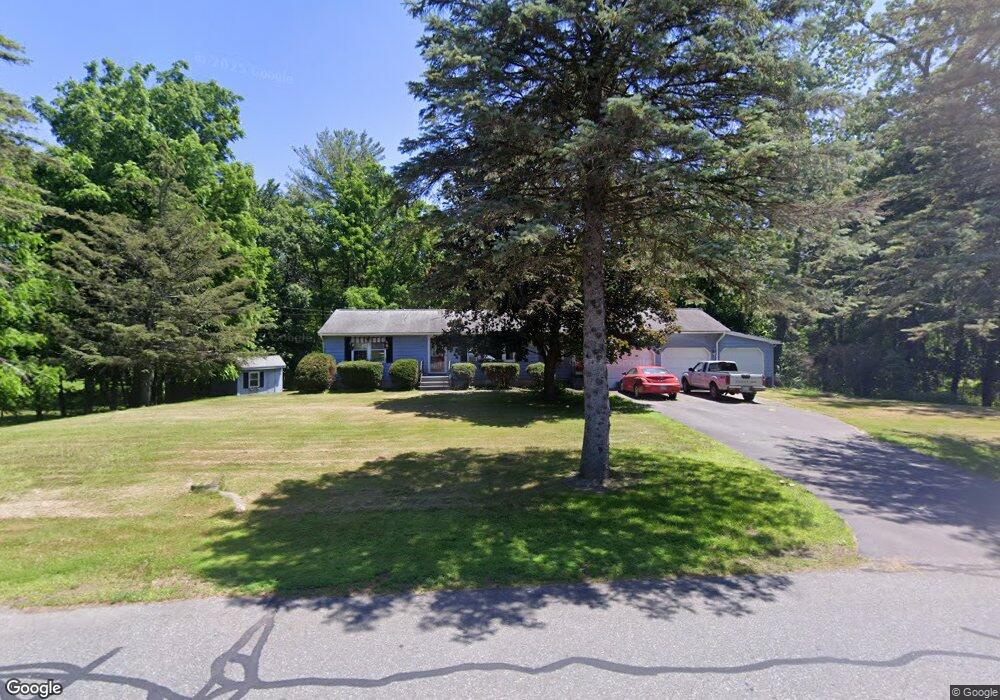
13 Cherry St Greenfield, MA 01301
Estimated Value: $312,000 - $372,000
3
Beds
2
Baths
1,096
Sq Ft
$321/Sq Ft
Est. Value
About This Home
This home is located at 13 Cherry St, Greenfield, MA 01301 and is currently estimated at $351,442, approximately $320 per square foot. 13 Cherry St is a home located in Franklin County with nearby schools including Greenfield Center School, Cornerstone Christian School, and Holy Trinity School.
Ownership History
Date
Name
Owned For
Owner Type
Purchase Details
Closed on
Feb 12, 2018
Sold by
Belanger Edward O
Bought by
Belanger Allison R and Belanger Jeffrey M
Current Estimated Value
Purchase Details
Closed on
Feb 17, 2006
Sold by
Nowicki Suzanne M
Bought by
Belanger Edward O
Home Financials for this Owner
Home Financials are based on the most recent Mortgage that was taken out on this home.
Original Mortgage
$100,000
Interest Rate
6.23%
Mortgage Type
Purchase Money Mortgage
Purchase Details
Closed on
Jan 18, 1994
Sold by
Masiello Caral M and Noyes William B
Bought by
Nowicki Suzanne M
Home Financials for this Owner
Home Financials are based on the most recent Mortgage that was taken out on this home.
Original Mortgage
$74,400
Interest Rate
7.22%
Mortgage Type
Purchase Money Mortgage
Purchase Details
Closed on
Mar 30, 1990
Sold by
Noyes Baxter B
Bought by
N E Investors Grp
Create a Home Valuation Report for This Property
The Home Valuation Report is an in-depth analysis detailing your home's value as well as a comparison with similar homes in the area
Home Values in the Area
Average Home Value in this Area
Purchase History
| Date | Buyer | Sale Price | Title Company |
|---|---|---|---|
| Belanger Allison R | -- | -- | |
| Belanger Allison R | -- | -- | |
| Belanger Edward O | $223,500 | -- | |
| Belanger Edward O | $223,500 | -- | |
| Nowicki Suzanne M | $93,000 | -- | |
| Nowicki Suzanne M | $93,000 | -- | |
| N E Investors Grp | $60,000 | -- |
Source: Public Records
Mortgage History
| Date | Status | Borrower | Loan Amount |
|---|---|---|---|
| Previous Owner | Belanger Edward O | $100,000 | |
| Previous Owner | N E Investors Grp | $15,000 | |
| Previous Owner | N E Investors Grp | $10,000 | |
| Previous Owner | N E Investors Grp | $74,400 |
Source: Public Records
Tax History Compared to Growth
Tax History
| Year | Tax Paid | Tax Assessment Tax Assessment Total Assessment is a certain percentage of the fair market value that is determined by local assessors to be the total taxable value of land and additions on the property. | Land | Improvement |
|---|---|---|---|---|
| 2025 | $5,154 | $263,500 | $83,900 | $179,600 |
| 2024 | $5,960 | $292,300 | $76,300 | $216,000 |
| 2023 | $5,192 | $264,200 | $76,300 | $187,900 |
| 2022 | $5,131 | $229,900 | $72,600 | $157,300 |
| 2021 | $5,064 | $218,100 | $73,400 | $144,700 |
| 2020 | $4,568 | $199,200 | $66,800 | $132,400 |
| 2019 | $4,277 | $191,300 | $58,100 | $133,200 |
| 2018 | $4,253 | $189,600 | $57,400 | $132,200 |
| 2017 | $4,120 | $189,600 | $57,400 | $132,200 |
| 2016 | $3,961 | $181,600 | $56,300 | $125,300 |
| 2015 | $4,036 | $179,300 | $54,500 | $124,800 |
| 2014 | $3,681 | $179,300 | $54,500 | $124,800 |
Source: Public Records
Map
Nearby Homes