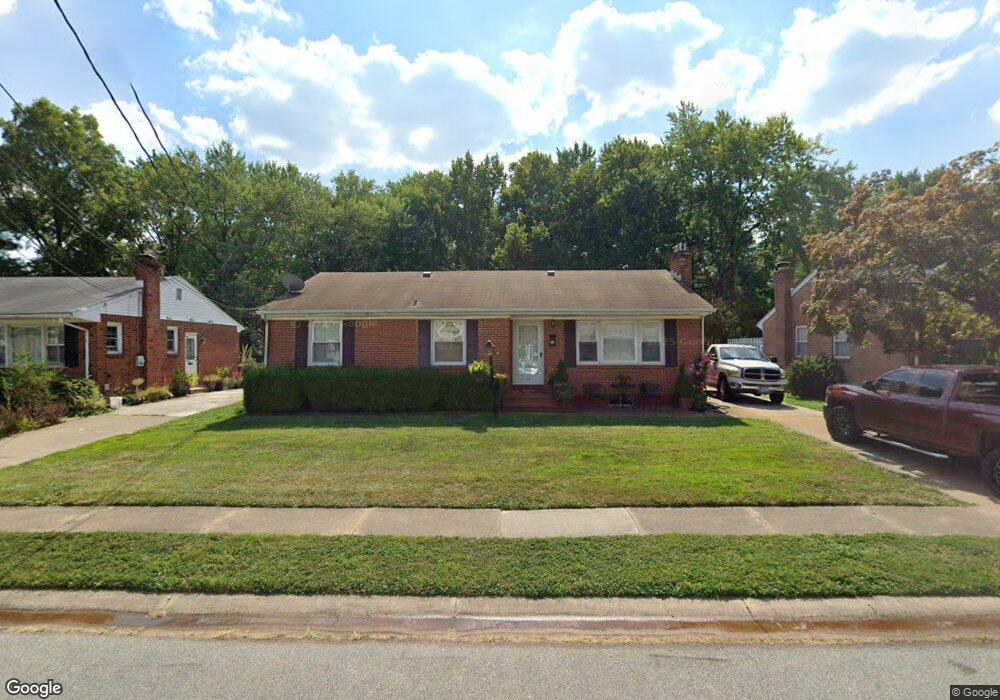
13 E Burton Ave New Castle, DE 19720
Estimated Value: $292,000 - $306,000
3
Beds
1
Bath
1,310
Sq Ft
$228/Sq Ft
Est. Value
About This Home
This home is located at 13 E Burton Ave, New Castle, DE 19720 and is currently estimated at $298,464, approximately $227 per square foot. 13 E Burton Ave is a home with nearby schools including New Castle Elementary School, Calvin R. McCullough Middle School, and Charter School of New Castle.
Ownership History
Date
Name
Owned For
Owner Type
Purchase Details
Closed on
Jul 2, 2024
Sold by
Tarango Santos I
Bought by
Morales Rosa E and Tarango Rosa E
Current Estimated Value
Purchase Details
Closed on
Mar 21, 2002
Sold by
Bridgewater Clay and Bridgewater Alice L
Bought by
Tarango Santos I and Tarango Rosa E
Home Financials for this Owner
Home Financials are based on the most recent Mortgage that was taken out on this home.
Original Mortgage
$129,200
Interest Rate
6.91%
Create a Home Valuation Report for This Property
The Home Valuation Report is an in-depth analysis detailing your home's value as well as a comparison with similar homes in the area
Home Values in the Area
Average Home Value in this Area
Purchase History
| Date | Buyer | Sale Price | Title Company |
|---|---|---|---|
| Morales Rosa E | -- | None Listed On Document | |
| Tarango Santos I | $129,900 | -- |
Source: Public Records
Mortgage History
| Date | Status | Borrower | Loan Amount |
|---|---|---|---|
| Previous Owner | Tarango Santos I | $129,200 |
Source: Public Records
Tax History Compared to Growth
Tax History
| Year | Tax Paid | Tax Assessment Tax Assessment Total Assessment is a certain percentage of the fair market value that is determined by local assessors to be the total taxable value of land and additions on the property. | Land | Improvement |
|---|---|---|---|---|
| 2024 | $1,830 | $53,300 | $9,600 | $43,700 |
| 2023 | $1,664 | $53,300 | $9,600 | $43,700 |
| 2022 | $1,733 | $53,300 | $9,600 | $43,700 |
| 2021 | $1,732 | $53,300 | $9,600 | $43,700 |
| 2020 | $0 | $53,300 | $9,600 | $43,700 |
| 2019 | $1,866 | $53,300 | $9,600 | $43,700 |
| 2018 | $1,708 | $53,300 | $9,600 | $43,700 |
| 2017 | $1,598 | $53,300 | $9,600 | $43,700 |
| 2016 | $1,430 | $53,300 | $9,600 | $43,700 |
| 2015 | $1,429 | $53,300 | $9,600 | $43,700 |
| 2014 | $1,431 | $53,300 | $9,600 | $43,700 |
Source: Public Records
Map
Nearby Homes