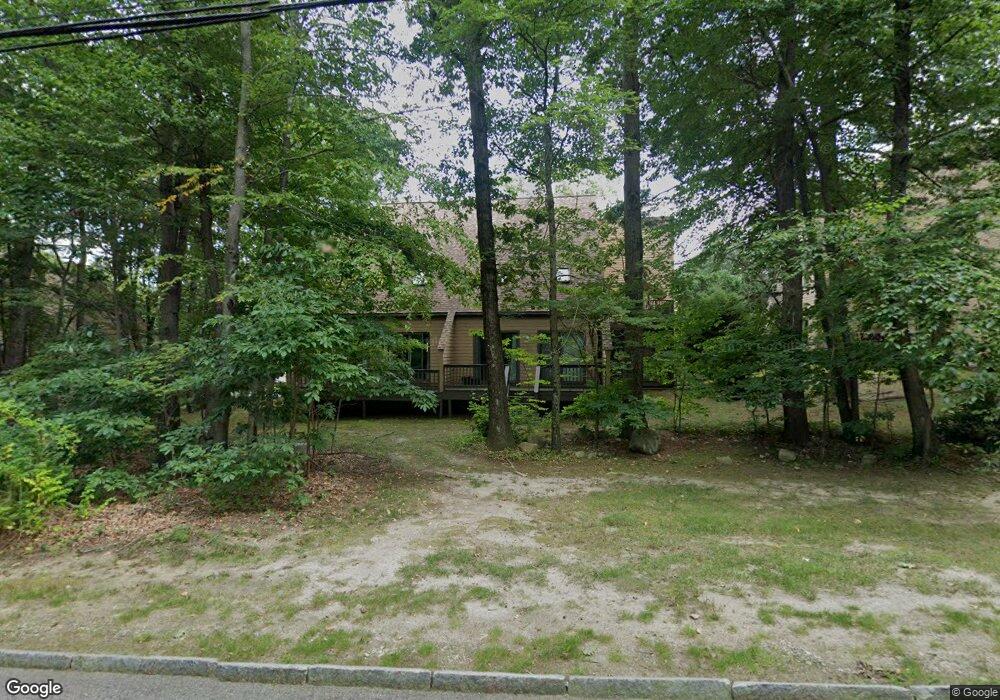
13 Emerson Way Franklin, MA 02038
Estimated Value: $457,000 - $486,996
2
Beds
3
Baths
1,645
Sq Ft
$291/Sq Ft
Est. Value
About This Home
This home is located at 13 Emerson Way, Franklin, MA 02038 and is currently estimated at $478,749, approximately $291 per square foot. 13 Emerson Way is a home located in Norfolk County with nearby schools including Oak Street Elementary School, Horace Mann Middle School, and Franklin High School.
Ownership History
Date
Name
Owned For
Owner Type
Purchase Details
Closed on
Jun 14, 2017
Sold by
Bhakta Ashok and Pai Alka R
Bought by
Qi Jian and Chen Ling
Current Estimated Value
Home Financials for this Owner
Home Financials are based on the most recent Mortgage that was taken out on this home.
Original Mortgage
$243,000
Outstanding Balance
$199,929
Interest Rate
3.63%
Mortgage Type
Adjustable Rate Mortgage/ARM
Estimated Equity
$278,820
Purchase Details
Closed on
Feb 22, 2002
Sold by
Marcelino Celeste H
Bought by
Bhakta Ashok
Home Financials for this Owner
Home Financials are based on the most recent Mortgage that was taken out on this home.
Original Mortgage
$178,400
Interest Rate
7.08%
Mortgage Type
Purchase Money Mortgage
Create a Home Valuation Report for This Property
The Home Valuation Report is an in-depth analysis detailing your home's value as well as a comparison with similar homes in the area
Home Values in the Area
Average Home Value in this Area
Purchase History
| Date | Buyer | Sale Price | Title Company |
|---|---|---|---|
| Qi Jian | $270,000 | -- | |
| Bhakta Ashok | $223,000 | -- |
Source: Public Records
Mortgage History
| Date | Status | Borrower | Loan Amount |
|---|---|---|---|
| Open | Qi Jian | $243,000 | |
| Previous Owner | Bhakta Ashok | $178,400 |
Source: Public Records
Tax History Compared to Growth
Tax History
| Year | Tax Paid | Tax Assessment Tax Assessment Total Assessment is a certain percentage of the fair market value that is determined by local assessors to be the total taxable value of land and additions on the property. | Land | Improvement |
|---|---|---|---|---|
| 2025 | $4,987 | $429,200 | $0 | $429,200 |
| 2024 | $5,060 | $429,200 | $0 | $429,200 |
| 2023 | $4,597 | $365,400 | $0 | $365,400 |
| 2022 | $4,663 | $331,900 | $0 | $331,900 |
| 2021 | $4,697 | $320,600 | $0 | $320,600 |
| 2020 | $4,064 | $280,100 | $0 | $280,100 |
| 2019 | $3,782 | $258,000 | $0 | $258,000 |
| 2018 | $3,838 | $262,000 | $0 | $262,000 |
| 2017 | $3,193 | $219,000 | $0 | $219,000 |
| 2016 | $3,278 | $226,100 | $0 | $226,100 |
| 2015 | $3,222 | $217,100 | $0 | $217,100 |
| 2014 | $2,909 | $201,300 | $0 | $201,300 |
Source: Public Records
Map
Nearby Homes
- 109 Stone Ridge Rd Unit 109
- 16 Danforth Way
- 151 Stone Ridge Rd
- 33 Stone Ridge Rd Unit 33
- 605 Franklin Crossing Rd
- 1805 Franklin Crossing Rd
- 2211 Franklin Crossing Rd Unit 2211
- 214 Conlyn Ave
- 159 Highwood Dr
- 31 Highwood Dr
- 57 Raymond St Unit 2
- 66 Highwood Dr
- 97 Fisher St
- 6 Buena Vista Dr
- 208 Irondequoit Rd
- 1 Joy St
- 246 Washington St
- 374-378 Union St
- 120 Union St Unit 1
- 417 Union St
- 15 Emerson Way
- 13 Emerson Way Unit 13
- 9 Emerson Way
- 11 Emerson Way
- 11 Emerson Way Unit A
- 9 Emerson Way Unit 9
- 9 Emerson Way Unit 1B
- 19 Emerson Way
- 4 Clarendon Common
- 2 Clarendon Common
- 2 Clarendon Common Unit 2
- 16 Clarendon Common
- 14 Clarendon Common
- 16 Clarendon Common Unit 16
- 8 Clarendon Common
- 6 Clarendon Common
- 8 Clarendon Common Unit 8
- 8 Clarendon Common Unit 26B
- 12 Clarendon Common
- 10 Clarendon Common