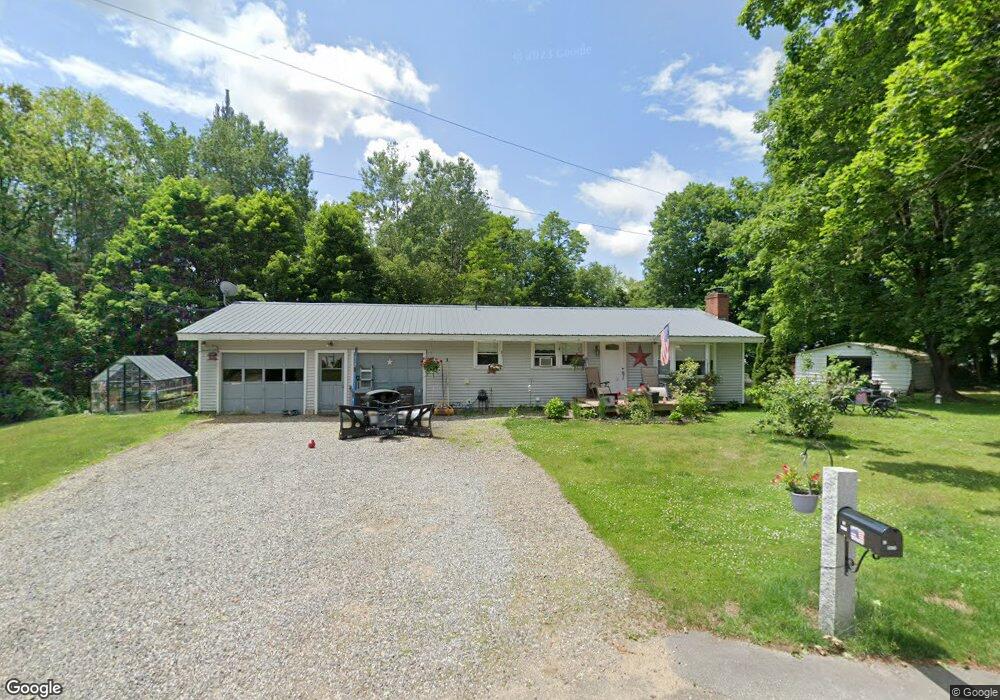
13 Mark Rd Franklin, NH 03235
Estimated Value: $372,000 - $431,000
3
Beds
1
Bath
1,026
Sq Ft
$381/Sq Ft
Est. Value
About This Home
This home is located at 13 Mark Rd, Franklin, NH 03235 and is currently estimated at $390,414, approximately $380 per square foot. 13 Mark Rd is a home located in Merrimack County with nearby schools including Paul A. Smith School, Franklin Middle School, and Franklin High School.
Ownership History
Date
Name
Owned For
Owner Type
Purchase Details
Closed on
Feb 11, 2022
Sold by
Smith Cheryl L and Smith Stuart B
Bought by
Cheryl Smith Ret and Smith
Current Estimated Value
Purchase Details
Closed on
Aug 31, 2009
Sold by
Fnma
Bought by
Smith Stuart
Home Financials for this Owner
Home Financials are based on the most recent Mortgage that was taken out on this home.
Original Mortgage
$155,138
Interest Rate
5.17%
Mortgage Type
Purchase Money Mortgage
Purchase Details
Closed on
Jun 12, 2009
Sold by
Duquette John S and Fnma
Bought by
Federal National Mortgage Association
Purchase Details
Closed on
Nov 2, 1999
Sold by
Gilman Est Ruth I
Bought by
Graves John M and Graves Roberta U
Home Financials for this Owner
Home Financials are based on the most recent Mortgage that was taken out on this home.
Original Mortgage
$65,000
Interest Rate
7.78%
Mortgage Type
Purchase Money Mortgage
Create a Home Valuation Report for This Property
The Home Valuation Report is an in-depth analysis detailing your home's value as well as a comparison with similar homes in the area
Home Values in the Area
Average Home Value in this Area
Purchase History
| Date | Buyer | Sale Price | Title Company |
|---|---|---|---|
| Cheryl Smith Ret | -- | None Available | |
| Smith Stuart | $158,000 | -- | |
| Federal National Mortgage Association | $141,900 | -- | |
| Graves John M | $75,000 | -- |
Source: Public Records
Mortgage History
| Date | Status | Borrower | Loan Amount |
|---|---|---|---|
| Previous Owner | Graves John M | $155,138 | |
| Previous Owner | Graves John M | $65,000 |
Source: Public Records
Tax History
| Year | Tax Paid | Tax Assessment Tax Assessment Total Assessment is a certain percentage of the fair market value that is determined by local assessors to be the total taxable value of land and additions on the property. | Land | Improvement |
|---|---|---|---|---|
| 2025 | $5,659 | $321,000 | $89,200 | $231,800 |
| 2024 | $5,505 | $321,000 | $89,200 | $231,800 |
| 2023 | $5,219 | $321,000 | $89,200 | $231,800 |
| 2022 | $4,624 | $189,600 | $73,600 | $116,000 |
| 2021 | $4,401 | $189,600 | $73,600 | $116,000 |
| 2020 | $4,330 | $189,600 | $73,600 | $116,000 |
| 2019 | $4,130 | $183,800 | $73,600 | $110,200 |
| 2018 | $3,616 | $183,800 | $73,600 | $110,200 |
| 2017 | $3,594 | $140,600 | $31,800 | $108,800 |
| 2016 | $3,547 | $140,600 | $31,800 | $108,800 |
| 2015 | $2,456 | $98,420 | $22,260 | $76,160 |
| 2011 | $3,413 | $158,600 | $36,800 | $121,800 |
Source: Public Records
Map
Nearby Homes
- 24 Munroe St Unit 1&2
- 225 Kendall St
- Lot 4 Piper St
- 18 Highland Ave
- 12 Village Way Unit 38
- 416 Central St
- 40 Millstone Dr Unit 60
- 48 Millstone Dr Unit 58
- 22 Stonehenge Cir Unit 7
- 11 Stonehenge Cir Unit 2
- 15 Millstone Dr Unit 15
- 41 Village Way Unit 22
- 9 Stonehenge Cir Unit 1
- 12 Stonehenge Cir
- 14 Stonehenge Cir Unit 11
- 50 Millstone Dr Unit 57
- 0 Rowell Dr Unit 406 5043422
- 88 Franklin St
- 5 Evans Ct
- 69 Cheney St
Your Personal Tour Guide
Ask me questions while you tour the home.