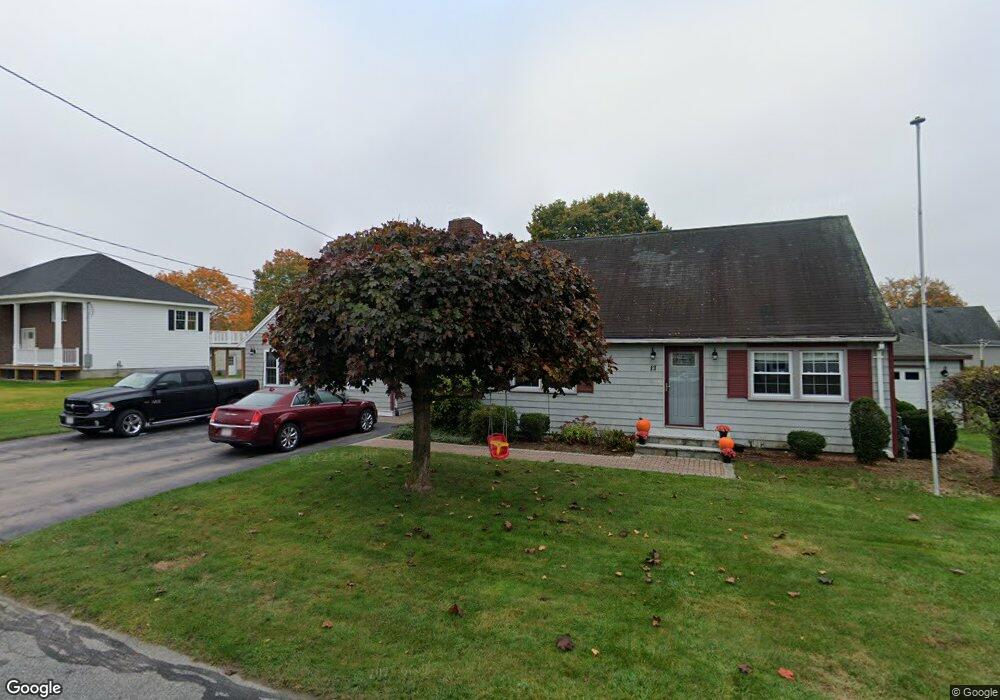
13 Naples St Milford, MA 01757
Estimated Value: $606,000 - $699,000
4
Beds
3
Baths
2,649
Sq Ft
$244/Sq Ft
Est. Value
About This Home
This home is located at 13 Naples St, Milford, MA 01757 and is currently estimated at $647,511, approximately $244 per square foot. 13 Naples St is a home located in Worcester County with nearby schools including Milford High School and Bethany Christian Academy.
Ownership History
Date
Name
Owned For
Owner Type
Purchase Details
Closed on
Apr 16, 2024
Sold by
Salmon Patrick and Salmon Robin
Bought by
Salmon Ft and Salmon
Current Estimated Value
Purchase Details
Closed on
Aug 27, 2009
Sold by
Salmon Robin and Stoico Robert V
Bought by
Salmon Patrick and Salmon Robin
Home Financials for this Owner
Home Financials are based on the most recent Mortgage that was taken out on this home.
Original Mortgage
$222,000
Interest Rate
5.17%
Mortgage Type
Purchase Money Mortgage
Create a Home Valuation Report for This Property
The Home Valuation Report is an in-depth analysis detailing your home's value as well as a comparison with similar homes in the area
Home Values in the Area
Average Home Value in this Area
Purchase History
| Date | Buyer | Sale Price | Title Company |
|---|---|---|---|
| Salmon Ft | -- | None Available | |
| Salmon Ft | -- | None Available | |
| Salmon Patrick | $300,000 | -- | |
| Salmon Patrick | $300,000 | -- |
Source: Public Records
Mortgage History
| Date | Status | Borrower | Loan Amount |
|---|---|---|---|
| Previous Owner | Salmon Patrick | $25,000 | |
| Previous Owner | Salmon Patrick | $222,000 |
Source: Public Records
Tax History Compared to Growth
Tax History
| Year | Tax Paid | Tax Assessment Tax Assessment Total Assessment is a certain percentage of the fair market value that is determined by local assessors to be the total taxable value of land and additions on the property. | Land | Improvement |
|---|---|---|---|---|
| 2025 | $7,124 | $556,600 | $181,400 | $375,200 |
| 2024 | $6,943 | $522,400 | $174,100 | $348,300 |
| 2023 | $6,726 | $465,500 | $145,100 | $320,400 |
| 2022 | $6,451 | $419,200 | $134,200 | $285,000 |
| 2021 | $6,008 | $376,000 | $134,200 | $241,800 |
| 2020 | $5,830 | $365,300 | $134,200 | $231,100 |
| 2019 | $5,660 | $342,200 | $134,200 | $208,000 |
| 2018 | $5,344 | $322,700 | $128,800 | $193,900 |
| 2017 | $5,191 | $309,200 | $128,800 | $180,400 |
| 2016 | $5,035 | $293,100 | $128,800 | $164,300 |
| 2015 | $4,916 | $280,100 | $123,300 | $156,800 |
Source: Public Records
Map
Nearby Homes
- Lot 1 Florence St
- 15 Free St
- 4 E Charles St
- 17 Middleton St
- 35 Woodland Ave Unit 35A
- 27 Grant St
- 39 Emmons St
- 104 Purchase St
- 57 Beach St
- 9 Hillside Ave
- 55 Jefferson St
- 3 Shadowbrook Ln Unit 3
- 102-104 Central St
- 130 Purchase St
- 11 Shadowbrook Ln Unit 9
- 12 Blanchard Rd
- 3 S Central St
- 56 S Bow St
- 2 Larson Rd
- 4 Kennedy Ln Unit 49