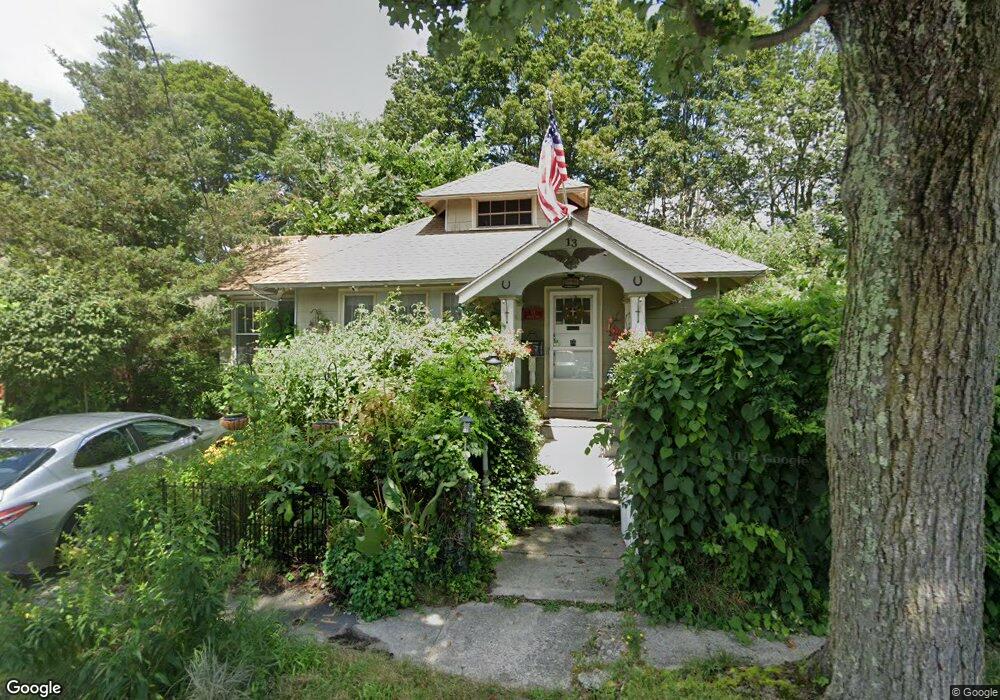
13 Norgate Rd Methuen, MA 01844
Downtown Methuen NeighborhoodEstimated Value: $407,000 - $496,000
2
Beds
1
Bath
1,258
Sq Ft
$371/Sq Ft
Est. Value
About This Home
This home is located at 13 Norgate Rd, Methuen, MA 01844 and is currently estimated at $466,623, approximately $370 per square foot. 13 Norgate Rd is a home located in Essex County with nearby schools including Marsh Grammar School, Methuen High School, and The Islamic Academy For Peace.
Ownership History
Date
Name
Owned For
Owner Type
Purchase Details
Closed on
May 4, 1998
Sold by
Gerade Mary J
Bought by
Hicks Robert B
Current Estimated Value
Home Financials for this Owner
Home Financials are based on the most recent Mortgage that was taken out on this home.
Original Mortgage
$83,100
Outstanding Balance
$15,229
Interest Rate
7.04%
Mortgage Type
Purchase Money Mortgage
Estimated Equity
$451,394
Purchase Details
Closed on
Mar 10, 1995
Sold by
Citicorp Mtg Inc
Bought by
Gerade Mary J
Home Financials for this Owner
Home Financials are based on the most recent Mortgage that was taken out on this home.
Original Mortgage
$50,350
Interest Rate
9.09%
Mortgage Type
Purchase Money Mortgage
Purchase Details
Closed on
Oct 17, 1994
Sold by
Niedbala Robert
Bought by
Citicorp Mtg Inc
Create a Home Valuation Report for This Property
The Home Valuation Report is an in-depth analysis detailing your home's value as well as a comparison with similar homes in the area
Home Values in the Area
Average Home Value in this Area
Purchase History
| Date | Buyer | Sale Price | Title Company |
|---|---|---|---|
| Hicks Robert B | $85,700 | -- | |
| Hicks Robert B | $85,700 | -- | |
| Gerade Mary J | $53,000 | -- | |
| Gerade Mary J | $53,000 | -- | |
| Citicorp Mtg Inc | $49,000 | -- | |
| Citicorp Mtg Inc | $49,000 | -- |
Source: Public Records
Mortgage History
| Date | Status | Borrower | Loan Amount |
|---|---|---|---|
| Open | Hicks Robert B | $83,100 | |
| Closed | Citicorp Mtg Inc | $83,100 | |
| Previous Owner | Citicorp Mtg Inc | $50,350 |
Source: Public Records
Tax History
| Year | Tax Paid | Tax Assessment Tax Assessment Total Assessment is a certain percentage of the fair market value that is determined by local assessors to be the total taxable value of land and additions on the property. | Land | Improvement |
|---|---|---|---|---|
| 2025 | $4,119 | $389,300 | $183,500 | $205,800 |
| 2024 | $3,977 | $366,200 | $160,400 | $205,800 |
| 2023 | $3,783 | $323,300 | $141,100 | $182,200 |
| 2022 | $3,693 | $283,000 | $115,500 | $167,500 |
| 2021 | $3,486 | $264,300 | $109,000 | $155,300 |
| 2020 | $3,387 | $252,000 | $109,000 | $143,000 |
| 2019 | $3,091 | $217,800 | $99,500 | $118,300 |
| 2018 | $2,895 | $202,900 | $93,200 | $109,700 |
| 2017 | $2,721 | $185,700 | $87,000 | $98,700 |
| 2016 | $2,586 | $174,600 | $80,800 | $93,800 |
| 2015 | $2,549 | $174,600 | $80,800 | $93,800 |
Source: Public Records
Map
Nearby Homes
- 20-22 Ashland Ave
- 24 Railroad St
- 7 Field Ave
- 20 Ruskin Ave
- 7-9 Carleton Ct
- 9-11 Horne St
- 23 Chase St
- 23 Bentley Cir
- 37 Maplewood Ave
- 29 Center St
- 36 Manchester St
- 179-181 West St
- 82 Oakside Ave
- 434-438 Hampshire St
- 27 Willow St Unit A
- 97 Kenwood Rd
- 10 Holly St
- 65 Clayton Ave
- 50 Forest St
- 324-326 Broadway
Your Personal Tour Guide
Ask me questions while you tour the home.