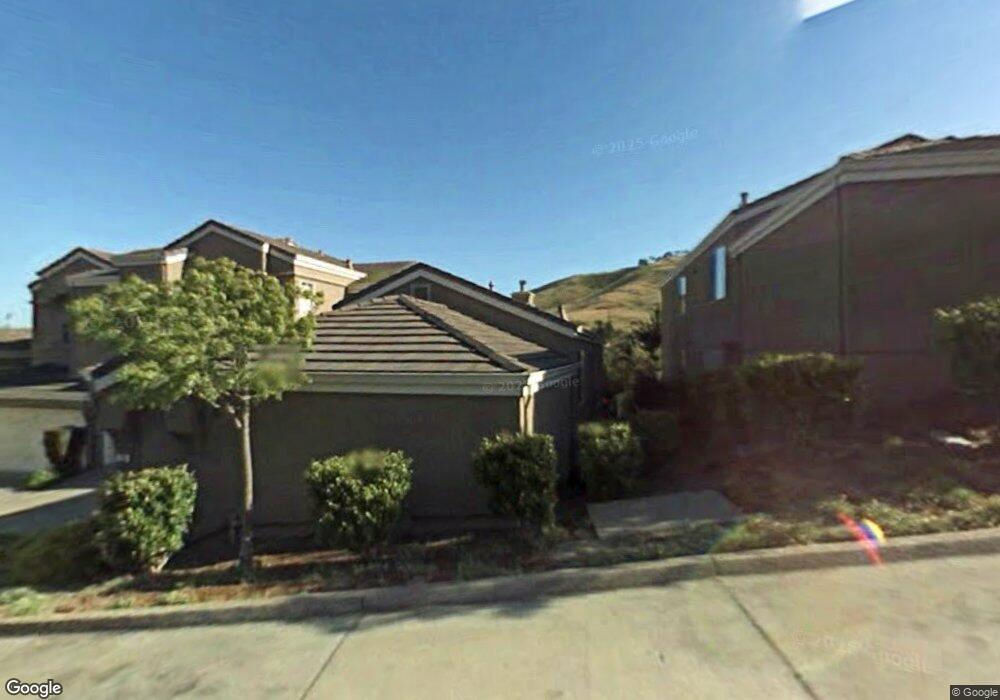
13 Northcrest Dr South San Francisco, CA 94080
Sign Hill NeighborhoodEstimated Value: $1,492,000 - $1,771,000
3
Beds
3
Baths
2,050
Sq Ft
$793/Sq Ft
Est. Value
About This Home
This home is located at 13 Northcrest Dr, South San Francisco, CA 94080 and is currently estimated at $1,625,272, approximately $792 per square foot. 13 Northcrest Dr is a home located in San Mateo County with nearby schools including Sunshine Gardens Elementary School, Parkway Heights Middle School, and South San Francisco High School.
Ownership History
Date
Name
Owned For
Owner Type
Purchase Details
Closed on
Sep 23, 2020
Sold by
Efimenko Anna B and Efimenko Anna B
Bought by
Anna Efimenko Living Trust and Efimenko
Current Estimated Value
Purchase Details
Closed on
Jan 28, 2000
Sold by
Patrick Hurley Michael
Bought by
Toulinov Nikita and Efimenko Anna B
Home Financials for this Owner
Home Financials are based on the most recent Mortgage that was taken out on this home.
Original Mortgage
$393,750
Interest Rate
7.96%
Mortgage Type
Stand Alone First
Purchase Details
Closed on
Nov 5, 1997
Sold by
Centex Homes
Bought by
Hurley Patrick J and Hurley Marilyn M
Home Financials for this Owner
Home Financials are based on the most recent Mortgage that was taken out on this home.
Original Mortgage
$331,300
Interest Rate
7.3%
Create a Home Valuation Report for This Property
The Home Valuation Report is an in-depth analysis detailing your home's value as well as a comparison with similar homes in the area
Home Values in the Area
Average Home Value in this Area
Purchase History
| Date | Buyer | Sale Price | Title Company |
|---|---|---|---|
| Anna Efimenko Living Trust | -- | None Listed On Document | |
| Toulinov Nikita | $525,000 | First American Title Co | |
| Hurley Michael Patrick | -- | -- | |
| Hurley Patrick J | $368,500 | -- |
Source: Public Records
Mortgage History
| Date | Status | Borrower | Loan Amount |
|---|---|---|---|
| Previous Owner | Toulinov Nikita | $393,750 | |
| Previous Owner | Hurley Patrick J | $331,300 |
Source: Public Records
Tax History Compared to Growth
Tax History
| Year | Tax Paid | Tax Assessment Tax Assessment Total Assessment is a certain percentage of the fair market value that is determined by local assessors to be the total taxable value of land and additions on the property. | Land | Improvement |
|---|---|---|---|---|
| 2025 | $9,394 | $806,894 | $403,447 | $403,447 |
| 2023 | $9,394 | $775,564 | $387,782 | $387,782 |
| 2022 | $8,726 | $760,358 | $380,179 | $380,179 |
| 2021 | $8,612 | $745,450 | $372,725 | $372,725 |
| 2020 | $8,505 | $737,808 | $368,904 | $368,904 |
| 2019 | $8,413 | $723,342 | $361,671 | $361,671 |
| 2018 | $8,211 | $709,160 | $354,580 | $354,580 |
| 2017 | $8,006 | $695,256 | $347,628 | $347,628 |
| 2016 | $7,849 | $681,624 | $340,812 | $340,812 |
| 2015 | $7,721 | $671,386 | $335,693 | $335,693 |
| 2014 | $7,556 | $658,236 | $329,118 | $329,118 |
Source: Public Records
Map
Nearby Homes
- 25 Windcrest Ln
- 8 Parkgrove Dr
- 121 Northcrest Dr
- 23 Pinnacle St
- 431 Beech Ave
- 404 Larch Ave
- 553 Diamond Ave
- 829 Stonegate Dr
- 728 Cottonwood Ave
- 577 Miller Ave
- 311 Magnolia Ave
- 3 Mandalay Place
- 729 Grand Ave
- 738 Baden Ave
- 253 Kings Rd
- 400 Miller Ave
- 645 Baden Ave Unit 4
- 453 Grand Ave
- 00 Beatrice Rd
- 316 Humboldt Rd
- 9 Northcrest Dr
- 17 Northcrest Dr
- 5 Northcrest Dr
- 21 Northcrest Dr
- 1 Northcrest Dr
- 25 Northcrest Dr
- 29 Northcrest Dr
- 33 Northcrest Dr
- 71 Baypark Cir
- 37 Northcrest Dr
- 65 Baypark Cir
- 39 Northcrest Dr
- 61 Baypark Cir
- 51 Northcrest Dr
- 38 Northcrest Dr
- 55 Northcrest Dr
- 50 Northcrest Dr
- 35 Baypark Cir
- 51 Baypark Cir
- 52 Northcrest Dr