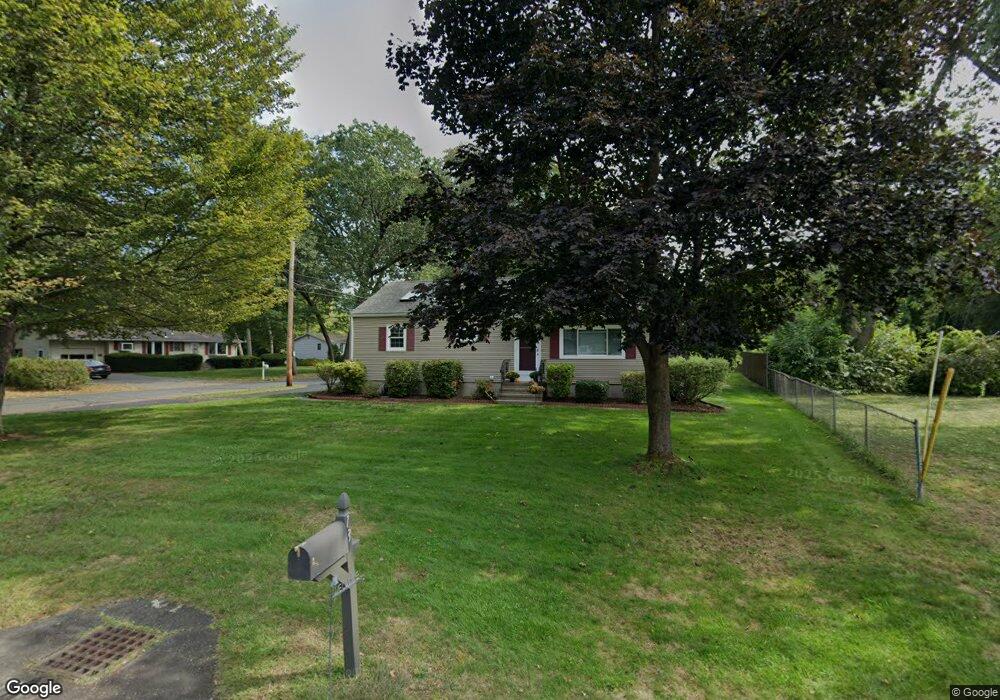
13 Oak Ave South Hadley, MA 01075
Estimated Value: $317,000 - $328,000
3
Beds
1
Bath
1,008
Sq Ft
$319/Sq Ft
Est. Value
About This Home
This home is located at 13 Oak Ave, South Hadley, MA 01075 and is currently estimated at $321,479, approximately $318 per square foot. 13 Oak Ave is a home located in Hampshire County with nearby schools including Plains Elementary School, Mosier Elementary School, and Michael E. Smith Middle School.
Ownership History
Date
Name
Owned For
Owner Type
Purchase Details
Closed on
Aug 30, 2024
Sold by
Pelkey John and Pelkey Trudi
Bought by
Pelkey Derek J and Ross Lindsay K
Current Estimated Value
Purchase Details
Closed on
Nov 5, 1990
Sold by
Couture Mary L
Bought by
Pelkey John E
Create a Home Valuation Report for This Property
The Home Valuation Report is an in-depth analysis detailing your home's value as well as a comparison with similar homes in the area
Home Values in the Area
Average Home Value in this Area
Purchase History
| Date | Buyer | Sale Price | Title Company |
|---|---|---|---|
| Pelkey Derek J | -- | None Available | |
| Pelkey Derek J | -- | None Available | |
| Pelkey John E | $105,000 | -- | |
| Pelkey John E | $105,000 | -- |
Source: Public Records
Mortgage History
| Date | Status | Borrower | Loan Amount |
|---|---|---|---|
| Previous Owner | Pelkey John E | $87,300 | |
| Previous Owner | Pelkey John E | $85,000 | |
| Previous Owner | Pelkey John E | $32,900 |
Source: Public Records
Tax History Compared to Growth
Tax History
| Year | Tax Paid | Tax Assessment Tax Assessment Total Assessment is a certain percentage of the fair market value that is determined by local assessors to be the total taxable value of land and additions on the property. | Land | Improvement |
|---|---|---|---|---|
| 2025 | $4,637 | $291,100 | $109,100 | $182,000 |
| 2024 | $4,640 | $278,700 | $101,900 | $176,800 |
| 2023 | $4,044 | $230,400 | $92,600 | $137,800 |
| 2022 | $3,864 | $209,100 | $92,600 | $116,500 |
| 2021 | $3,808 | $195,700 | $86,500 | $109,200 |
| 2020 | $3,759 | $188,500 | $86,500 | $102,000 |
| 2019 | $3,577 | $177,500 | $82,400 | $95,100 |
| 2018 | $3,450 | $173,100 | $80,000 | $93,100 |
| 2017 | $3,356 | $166,800 | $80,000 | $86,800 |
| 2016 | $3,345 | $168,500 | $80,000 | $88,500 |
| 2015 | $3,174 | $163,800 | $77,600 | $86,200 |
Source: Public Records
Map
Nearby Homes
- 30 Yale St
- 0 Granby Rd
- 15 Karen Dr
- 25 Noel St
- 30 Pine Grove Dr
- 133 Granby Rd
- 63 Washington Ave
- 70 Pine Grove Dr Unit 70
- 73 Pine Grove Dr
- 18 Susan Ave
- 540 Granby Rd Unit 62
- 540 Granby Rd Unit 72A
- 540 Granby Rd Unit 109
- 318 Newton St
- 34 Hildreth Ave
- 586 Granby Rd
- 19 Hildreth Ave
- 32 North St
- 200 East St
- 30 Fairview Village Ct Unit 30