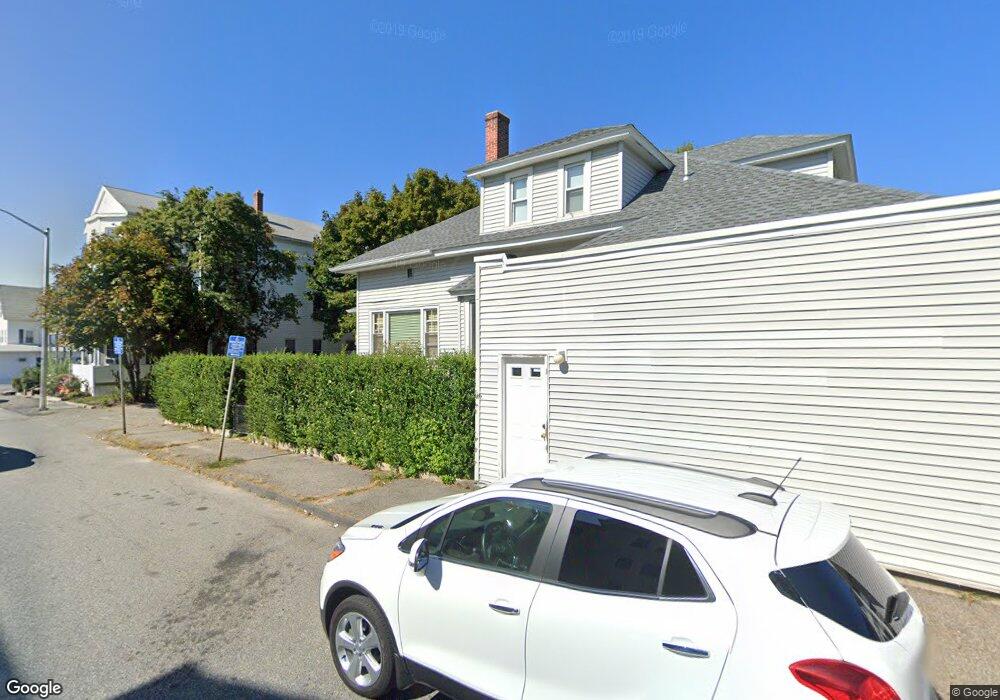
13 Orient St Worcester, MA 01604
Franklin Plantation NeighborhoodEstimated Value: $752,509
4
Beds
4
Baths
2,333
Sq Ft
$323/Sq Ft
Est. Value
About This Home
This home is located at 13 Orient St, Worcester, MA 01604 and is currently estimated at $752,509, approximately $322 per square foot. 13 Orient St is a home located in Worcester County with nearby schools including Jacob Hiatt Magnet School, Chandler Magnet, and Grafton Street.
Ownership History
Date
Name
Owned For
Owner Type
Purchase Details
Closed on
Jun 21, 2000
Sold by
Pulte Home Corp Ne
Bought by
Hill Earl E and Hil Melissa A
Current Estimated Value
Home Financials for this Owner
Home Financials are based on the most recent Mortgage that was taken out on this home.
Original Mortgage
$207,727
Outstanding Balance
$74,588
Interest Rate
8.48%
Mortgage Type
Commercial
Estimated Equity
$677,921
Purchase Details
Closed on
Apr 16, 1998
Sold by
Est Vigeant Arthur J and Vigeant Roger A
Bought by
Zenaro John and Papetti Rosanne
Home Financials for this Owner
Home Financials are based on the most recent Mortgage that was taken out on this home.
Original Mortgage
$82,260
Interest Rate
7.11%
Mortgage Type
Commercial
Create a Home Valuation Report for This Property
The Home Valuation Report is an in-depth analysis detailing your home's value as well as a comparison with similar homes in the area
Home Values in the Area
Average Home Value in this Area
Purchase History
| Date | Buyer | Sale Price | Title Company |
|---|---|---|---|
| Hill Earl E | $230,808 | -- | |
| Hill Earl E | $230,808 | -- | |
| Zenaro John | $83,000 | -- | |
| Zenaro John | $83,000 | -- |
Source: Public Records
Mortgage History
| Date | Status | Borrower | Loan Amount |
|---|---|---|---|
| Open | Zenaro John | $75,200 | |
| Open | Zenaro John | $207,727 | |
| Closed | Zenaro John | $207,727 | |
| Previous Owner | Zenaro John | $82,260 |
Source: Public Records
Tax History
| Year | Tax Paid | Tax Assessment Tax Assessment Total Assessment is a certain percentage of the fair market value that is determined by local assessors to be the total taxable value of land and additions on the property. | Land | Improvement |
|---|---|---|---|---|
| 2025 | -- | $385,000 | $97,900 | $287,100 |
| 2024 | -- | $385,000 | $97,900 | $287,100 |
| 2023 | $0 | $350,600 | $85,100 | $265,500 |
| 2022 | $0 | $272,900 | $68,100 | $204,800 |
| 2021 | $0 | $194,300 | $54,500 | $139,800 |
| 2020 | $0 | $185,800 | $54,500 | $131,300 |
| 2019 | $0 | $180,300 | $49,000 | $131,300 |
| 2018 | $0 | $176,200 | $49,000 | $127,200 |
| 2017 | $0 | $173,800 | $49,000 | $124,800 |
| 2016 | -- | $150,800 | $36,400 | $114,400 |
| 2015 | -- | $150,800 | $36,400 | $114,400 |
| 2014 | -- | $150,800 | $36,400 | $114,400 |
Source: Public Records
Map
Nearby Homes
- 5 Mcfarland Ct
- 13 Groton Place
- 9 Barclay St
- 35 Houghton St
- 57 Cutler St
- 56 Plantation St
- 112 Harrison St
- 21 Mott St
- 40 Aetna St
- 429 Grafton St Unit 2
- 47 Barclay St
- 81 Pilgrim Ave
- 61 Cohasset St
- 32 Providence St Unit 5
- 34 Robin Rd
- 22 Waverly St
- 155 Hamilton St Unit 4
- 1 Arlington St
- 49 South St
- 80 Delmont Ave
- 25 Branch St
- 15 Orient St
- 21 Branch St
- 9 Orient St
- 9 Orient St
- 9 Orient St Unit 3
- 9 Orient St Unit 1
- 26 Branch St
- 17 Orient St
- 10 Chrome St
- 16 Orient St Unit 3
- 16 Orient St Unit 2
- 16 Orient St Unit 1
- 16 Orient St
- 19 Orient St
- 14 Orient St
- 14 Orient St Unit 1
- 8 Orient St
- 8 Chrome St Unit 2
- 8 Chrome St Unit 3
Your Personal Tour Guide
Ask me questions while you tour the home.