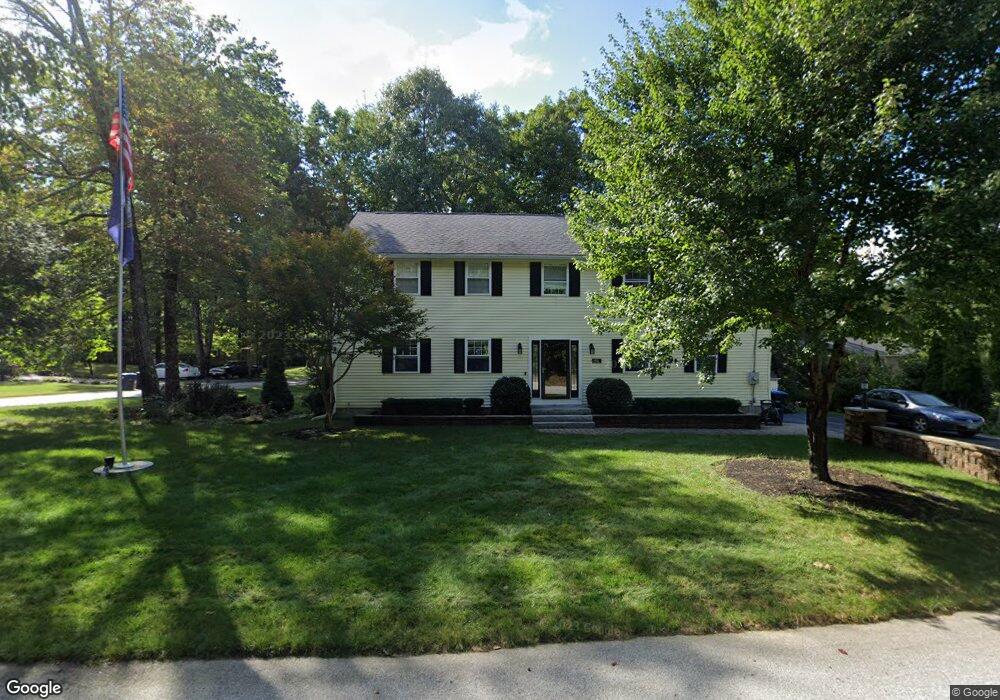
13 Park St Allenstown, NH 03275
Suncook NeighborhoodEstimated Value: $458,000 - $555,797
2
Beds
2
Baths
2,823
Sq Ft
$179/Sq Ft
Est. Value
About This Home
This home is located at 13 Park St, Allenstown, NH 03275 and is currently estimated at $505,949, approximately $179 per square foot. 13 Park St is a home located in Merrimack County with nearby schools including Allenstown Elementary School, Armand R. Dupont School, and Tender Years Child Care & Learning Center.
Ownership History
Date
Name
Owned For
Owner Type
Purchase Details
Closed on
Jul 25, 2000
Sold by
Maguire Edward J and Maguire Grace A
Bought by
Meservey Charles A and Meservey Jackie L
Current Estimated Value
Home Financials for this Owner
Home Financials are based on the most recent Mortgage that was taken out on this home.
Original Mortgage
$99,250
Outstanding Balance
$36,139
Interest Rate
8.28%
Estimated Equity
$469,810
Create a Home Valuation Report for This Property
The Home Valuation Report is an in-depth analysis detailing your home's value as well as a comparison with similar homes in the area
Home Values in the Area
Average Home Value in this Area
Purchase History
| Date | Buyer | Sale Price | Title Company |
|---|---|---|---|
| Meservey Charles A | $95,000 | -- |
Source: Public Records
Mortgage History
| Date | Status | Borrower | Loan Amount |
|---|---|---|---|
| Open | Meservey Charles A | $99,250 |
Source: Public Records
Tax History Compared to Growth
Tax History
| Year | Tax Paid | Tax Assessment Tax Assessment Total Assessment is a certain percentage of the fair market value that is determined by local assessors to be the total taxable value of land and additions on the property. | Land | Improvement |
|---|---|---|---|---|
| 2024 | $11,408 | $448,800 | $152,500 | $296,300 |
| 2023 | $9,515 | $448,800 | $152,500 | $296,300 |
| 2022 | $8,752 | $448,800 | $152,500 | $296,300 |
| 2021 | $8,407 | $266,900 | $86,700 | $180,200 |
| 2020 | $7,820 | $266,900 | $86,700 | $180,200 |
| 2019 | $8,260 | $265,600 | $86,700 | $178,900 |
| 2018 | $8,008 | $265,600 | $86,700 | $178,900 |
| 2017 | $8,528 | $265,600 | $86,700 | $178,900 |
| 2016 | $7,866 | $232,300 | $63,100 | $169,200 |
| 2015 | $7,626 | $232,300 | $63,100 | $169,200 |
| 2014 | $7,199 | $213,100 | $63,100 | $150,000 |
| 2013 | $6,719 | $213,100 | $63,100 | $150,000 |
Source: Public Records
Map
Nearby Homes
- 422 Dawn Dr Unit 23
- 427 Dawn Dr Unit 15
- 15 Main St
- 19 Sullivan Dr
- 4 Rodger Rd
- 7 Ferry St
- 10 Lane Dr
- 2 Cheryl Dr
- 1 1/2 Bartlett St
- 111 Glass St
- 100 Main St Unit M10
- 100 Main St Unit 204
- 12-14 Church St Unit 12,14
- 15 Sullivan Dr
- 1821 Hooksett Rd
- 10 Northview Terrace
- 14 Manor Dr Unit D
- 12 Manor Dr Unit B
- 307 Dearborn Rd
- 233 Pembroke St