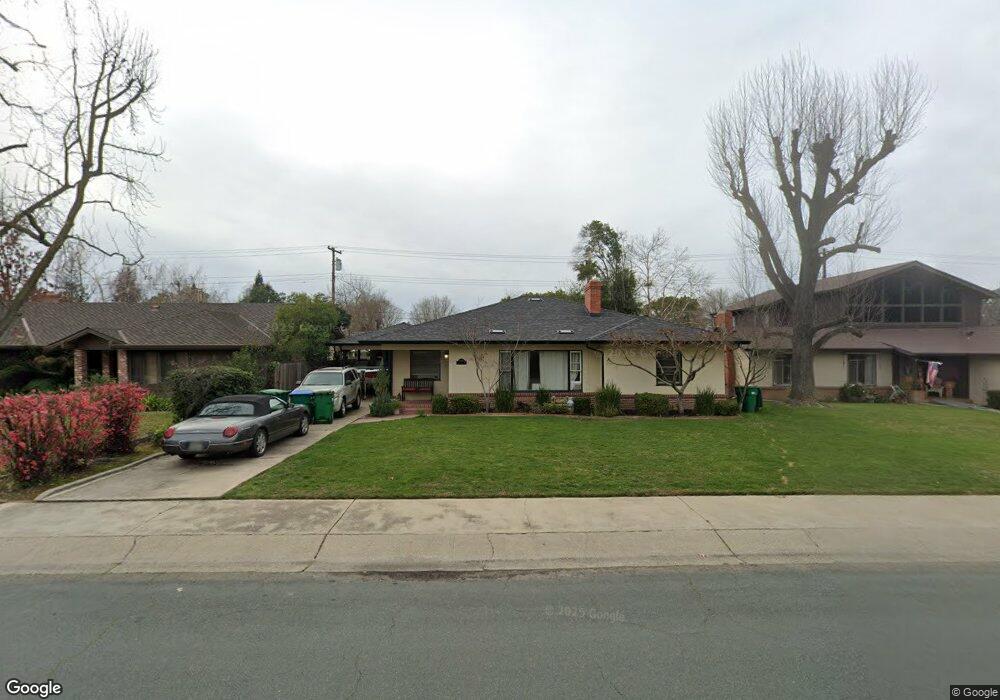
13 S Fairmont Ave Lodi, CA 95240
Downtown Lodi NeighborhoodEstimated Value: $417,000 - $553,000
2
Beds
2
Baths
1,497
Sq Ft
$327/Sq Ft
Est. Value
About This Home
This home is located at 13 S Fairmont Ave, Lodi, CA 95240 and is currently estimated at $489,076, approximately $326 per square foot. 13 S Fairmont Ave is a home located in San Joaquin County with nearby schools including George Washington Elementary School, Millswood Middle School, and Lodi High School.
Ownership History
Date
Name
Owned For
Owner Type
Purchase Details
Closed on
Oct 9, 1996
Sold by
Seidel Lillie E and Seidel Harris F
Bought by
Vallow Alan N
Current Estimated Value
Home Financials for this Owner
Home Financials are based on the most recent Mortgage that was taken out on this home.
Original Mortgage
$123,482
Outstanding Balance
$11,620
Interest Rate
8.37%
Mortgage Type
FHA
Estimated Equity
$477,456
Create a Home Valuation Report for This Property
The Home Valuation Report is an in-depth analysis detailing your home's value as well as a comparison with similar homes in the area
Home Values in the Area
Average Home Value in this Area
Purchase History
| Date | Buyer | Sale Price | Title Company |
|---|---|---|---|
| Vallow Alan N | $124,500 | Old Republic Title Company |
Source: Public Records
Mortgage History
| Date | Status | Borrower | Loan Amount |
|---|---|---|---|
| Open | Vallow Alan N | $123,482 |
Source: Public Records
Tax History Compared to Growth
Tax History
| Year | Tax Paid | Tax Assessment Tax Assessment Total Assessment is a certain percentage of the fair market value that is determined by local assessors to be the total taxable value of land and additions on the property. | Land | Improvement |
|---|---|---|---|---|
| 2025 | $2,141 | $202,753 | $89,568 | $113,185 |
| 2024 | $2,081 | $198,778 | $87,812 | $110,966 |
| 2023 | $2,047 | $194,882 | $86,091 | $108,791 |
| 2022 | $2,000 | $191,061 | $84,403 | $106,658 |
| 2021 | $2,035 | $187,316 | $82,749 | $104,567 |
| 2020 | $1,981 | $185,396 | $81,901 | $103,495 |
| 2019 | $1,940 | $181,762 | $80,296 | $101,466 |
| 2018 | $1,912 | $178,199 | $78,722 | $99,477 |
| 2017 | $1,868 | $174,706 | $77,179 | $97,527 |
| 2016 | $1,750 | $171,281 | $75,666 | $95,615 |
| 2014 | $1,706 | $165,404 | $73,070 | $92,334 |
Source: Public Records
Map
Nearby Homes
- 619 W Elm St
- 400 N Fairmont Ave
- 725 Costa Dr
- 431 W Elm St
- 1421 Graffigna Ave
- 380 S Sunset Dr
- 607 S Crescent Ave
- 542 Sturla St
- 648 Daisy Ave
- 912 Tara Place
- 19 N Pinewood Ct
- 411 W Locust St
- 1818 Capell Dr
- 852 Daisy Ave
- 2001 Jerry Ln
- 303 W Lockeford St
- 419 Matthew Plaza
- 317 Church St
- 18 Benson Dr
- 613 S Lee Ave
- 7 S Fairmont Ave
- 15 S Fairmont Ave
- 14 S Sunset Dr
- 20 S Sunset Dr
- 8 S Sunset Dr
- 1100 W Pine St
- 1101 W Oak St
- 26 S Sunset Dr
- 14 S Fairmont Ave
- 1110 W Pine St
- 8 S Fairmont Ave
- 20 S Fairmont Ave
- 1111 W Oak St
- 1010 W Pine St
- 1025 W Oak St
- 1101 W Pine St
- 13 S Sunset Dr
- 9 S Orange Ave
- 15 S Orange Ave
- 1111 W Pine St