13 Spring St Franklin, MA 02038
Estimated Value: $893,509 - $943,000
About This Home
This home is located at 13 Spring St, Franklin, MA 02038 and is currently estimated at $914,627, approximately $420 per square foot. 13 Spring St is a home located in Norfolk County with nearby schools including Jefferson Elementary School, Remington Middle School, and Franklin High School.
Ownership History
We collect this data history from publicly available records. To have your information removed, we recommend requesting removal directly through your county’s website.
Purchase Details
Purchase Details
Purchase History
We collect this data history from publicly available records. To have your information removed, we recommend requesting removal directly through your county’s website.
| Date | Buyer | Sale Price | Title Company |
|---|---|---|---|
| $120,035 | -- | ||
| -- | -- |
Tax History
We collect this data history from publicly available records. To have your information removed, we recommend requesting removal directly through your county’s website.
| Year | Tax Paid | Tax Assessment Tax Assessment Total Assessment is a certain percentage of the fair market value that is determined by local assessors to be the total taxable value of land and additions on the property. | Land | Improvement |
|---|---|---|---|---|
| 2025 | $9,438 | $812,200 | $262,200 | $550,000 |
| 2024 | $8,923 | $756,800 | $262,200 | $494,600 |
| 2023 | $9,523 | $757,000 | $361,200 | $395,800 |
| 2022 | $8,882 | $632,200 | $280,000 | $352,200 |
| 2021 | $8,113 | $553,800 | $269,600 | $284,200 |
| 2020 | $7,889 | $543,700 | $272,300 | $271,400 |
| 2019 | $7,654 | $522,100 | $250,500 | $271,600 |
| 2018 | $7,473 | $510,100 | $264,100 | $246,000 |
| 2017 | $7,557 | $518,300 | $272,300 | $246,000 |
| 2016 | $7,106 | $490,100 | $251,200 | $238,900 |
| 2015 | $6,225 | $419,500 | $227,100 | $192,400 |
| 2014 | $5,978 | $413,700 | $218,400 | $195,300 |
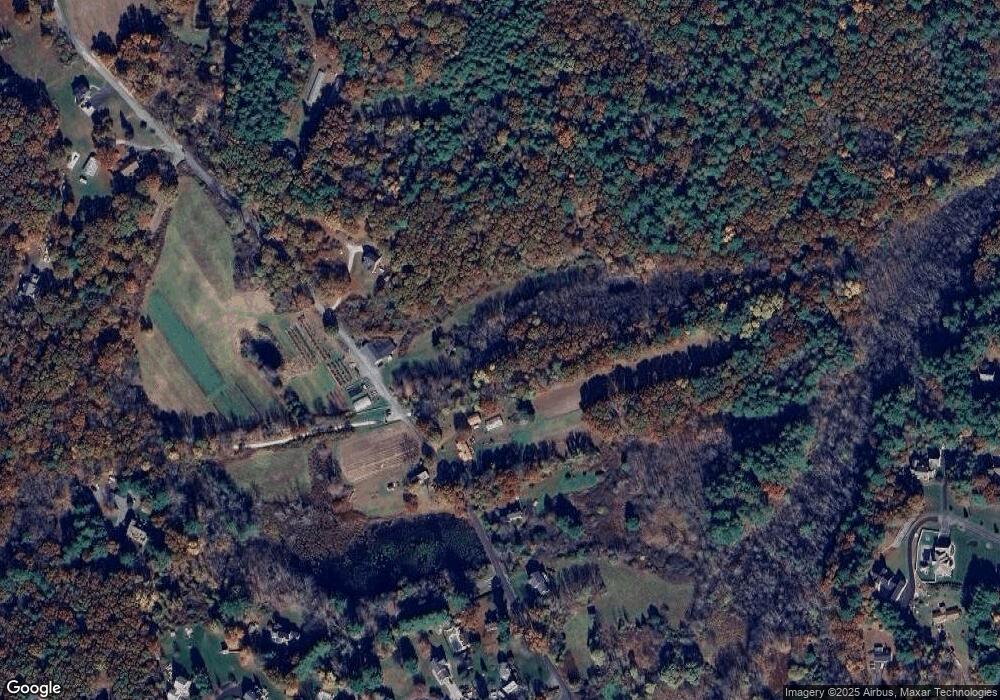
Map
- 2 Spring St
- 871 Washington St
- 250 Prospect St
- 241 Prospect St
- 900 Washington St Lot 2
- 11 Peters Ln
- 39 Opal Cir
- 31 Cassandra Ave Unit 31
- 83 Jefferson Rd
- 2 Harrison Place
- 425 Maple Brook Rd Unit 425
- 628 Maple Brook Rd Unit 628
- 51 Benjamin Landing Ln
- 4 Candlelight Ln
- 273 Lake St
- 1804 Old Bridge Ln Unit 1804
- 1003 Old Bridge Ln Unit 1003
- 57 A St Unit 57
- 3002 Maple Brook Rd Unit 3002
- 3301 Maple Brook Rd
Ask me questions while you tour the home.