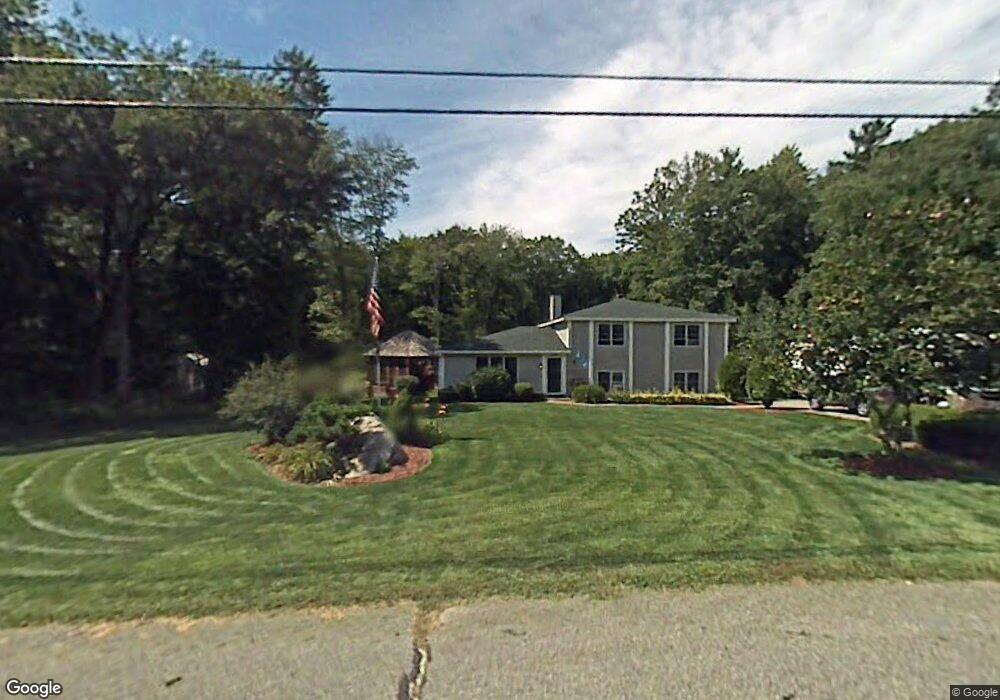
13 Surrey Ln Pelham, NH 03076
Estimated Value: $499,000 - $596,000
3
Beds
2
Baths
1,581
Sq Ft
$355/Sq Ft
Est. Value
About This Home
This home is located at 13 Surrey Ln, Pelham, NH 03076 and is currently estimated at $560,608, approximately $354 per square foot. 13 Surrey Ln is a home with nearby schools including Pelham Elementary School, Pelham Memorial School, and Pelham High School.
Ownership History
Date
Name
Owned For
Owner Type
Purchase Details
Closed on
Feb 28, 2019
Sold by
Larochelle John P and Larochelle Doris J
Bought by
Larochelle John P and Clarke-Larochelle Lisa M
Current Estimated Value
Home Financials for this Owner
Home Financials are based on the most recent Mortgage that was taken out on this home.
Original Mortgage
$131,461
Outstanding Balance
$116,381
Interest Rate
4.75%
Mortgage Type
FHA
Estimated Equity
$444,227
Purchase Details
Closed on
Aug 26, 1977
Bought by
Larochelle John P and Larochelle Doris J
Create a Home Valuation Report for This Property
The Home Valuation Report is an in-depth analysis detailing your home's value as well as a comparison with similar homes in the area
Home Values in the Area
Average Home Value in this Area
Purchase History
| Date | Buyer | Sale Price | Title Company |
|---|---|---|---|
| Larochelle John P | $136,000 | -- | |
| Larochelle John P | -- | -- |
Source: Public Records
Mortgage History
| Date | Status | Borrower | Loan Amount |
|---|---|---|---|
| Open | Larochelle John P | $131,461 | |
| Previous Owner | Larochelle John P | $170,000 | |
| Previous Owner | Larochelle John P | $126,500 |
Source: Public Records
Tax History Compared to Growth
Tax History
| Year | Tax Paid | Tax Assessment Tax Assessment Total Assessment is a certain percentage of the fair market value that is determined by local assessors to be the total taxable value of land and additions on the property. | Land | Improvement |
|---|---|---|---|---|
| 2024 | $7,450 | $406,200 | $160,900 | $245,300 |
| 2023 | $7,389 | $406,200 | $160,900 | $245,300 |
| 2022 | $7,076 | $406,200 | $160,900 | $245,300 |
| 2021 | $6,473 | $405,600 | $160,900 | $244,700 |
| 2020 | $6,545 | $324,000 | $128,800 | $195,200 |
| 2019 | $6,286 | $324,000 | $128,800 | $195,200 |
| 2018 | $6,449 | $300,500 | $128,800 | $171,700 |
| 2017 | $6,446 | $300,500 | $128,800 | $171,700 |
| 2016 | $5,979 | $285,400 | $128,800 | $156,600 |
| 2015 | $5,892 | $253,300 | $122,600 | $130,700 |
| 2014 | $5,793 | $253,300 | $122,600 | $130,700 |
| 2013 | $5,793 | $253,300 | $122,600 | $130,700 |
Source: Public Records
Map
Nearby Homes