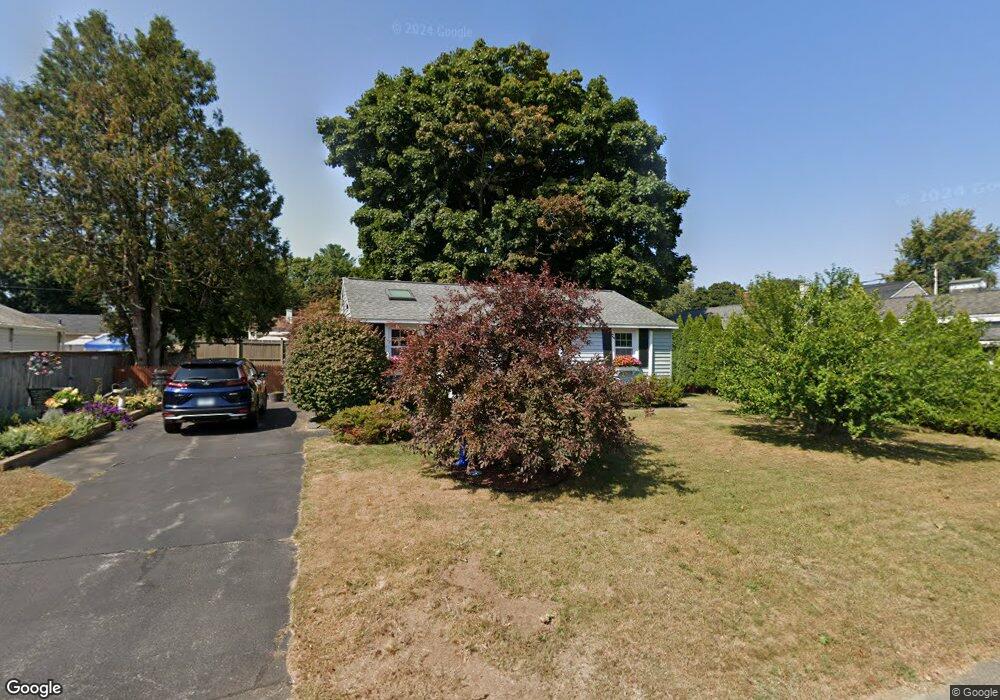
13 Tucker Ln Hampton, NH 03842
Estimated Value: $427,807 - $722,000
2
Beds
1
Bath
840
Sq Ft
$602/Sq Ft
Est. Value
About This Home
This home is located at 13 Tucker Ln, Hampton, NH 03842 and is currently estimated at $505,702, approximately $602 per square foot. 13 Tucker Ln is a home located in Rockingham County with nearby schools including Hampton Centre School, Adeline C. Marston Elementary School, and Hampton Academy.
Ownership History
Date
Name
Owned For
Owner Type
Purchase Details
Closed on
Sep 29, 2000
Sold by
Weed Kristen D and Weed Brian T
Bought by
Thompson Dorleen J
Current Estimated Value
Home Financials for this Owner
Home Financials are based on the most recent Mortgage that was taken out on this home.
Original Mortgage
$75,000
Outstanding Balance
$25,912
Interest Rate
7.94%
Estimated Equity
$479,790
Purchase Details
Closed on
May 27, 1998
Sold by
Callahan Dylan M and Callahan Theresa M
Bought by
Kulju Kristen D
Home Financials for this Owner
Home Financials are based on the most recent Mortgage that was taken out on this home.
Original Mortgage
$95,000
Interest Rate
7.12%
Purchase Details
Closed on
Mar 1, 1996
Sold by
Bogash Peter
Bought by
Callahan Dylan M and Callahan Theresa M
Home Financials for this Owner
Home Financials are based on the most recent Mortgage that was taken out on this home.
Original Mortgage
$89,750
Interest Rate
7.02%
Create a Home Valuation Report for This Property
The Home Valuation Report is an in-depth analysis detailing your home's value as well as a comparison with similar homes in the area
Home Values in the Area
Average Home Value in this Area
Purchase History
We collect this data history from publicly available records. To have your information removed, we recommend requesting removal directly through your county’s website.
| Date | Buyer | Sale Price | Title Company |
|---|---|---|---|
| Thompson Dorleen J | $159,900 | -- | |
| Kulju Kristen D | $100,000 | -- | |
| Callahan Dylan M | $88,000 | -- |
Source: Public Records
Mortgage History
We collect this data history from publicly available records. To have your information removed, we recommend requesting removal directly through your county’s website.
| Date | Status | Borrower | Loan Amount |
|---|---|---|---|
| Open | Callahan Dylan M | $75,000 | |
| Previous Owner | Callahan Dylan M | $95,000 | |
| Previous Owner | Callahan Dylan M | $89,750 |
Source: Public Records
Tax History
| Year | Tax Paid | Tax Assessment Tax Assessment Total Assessment is a certain percentage of the fair market value that is determined by local assessors to be the total taxable value of land and additions on the property. | Land | Improvement |
|---|---|---|---|---|
| 2025 | $4,232 | $343,500 | $231,400 | $112,100 |
| 2024 | $4,232 | $343,500 | $231,400 | $112,100 |
| 2023 | $3,859 | $230,400 | $154,300 | $76,100 |
| 2022 | $3,618 | $228,400 | $154,300 | $74,100 |
| 2021 | $3,618 | $228,400 | $154,300 | $74,100 |
| 2020 | $3,638 | $228,400 | $154,300 | $74,100 |
| 2019 | $3,657 | $228,400 | $154,300 | $74,100 |
| 2018 | $3,562 | $209,300 | $140,300 | $69,000 |
| 2017 | $3,426 | $209,300 | $140,300 | $69,000 |
| 2016 | $3,366 | $209,300 | $140,300 | $69,000 |
Source: Public Records
Map
Nearby Homes
- 21 Leavitt Rd
- 3 Windmill Ln
- 10 Mcdermott Rd
- 173 Winnacunnet Rd
- 243 Winnacunnet Rd
- 46 Mill Rd
- 16 Naves Rd
- 2 Hilliard Dr
- 7 Towle Ave
- 76 Seabury
- 24 Seabury
- 39 Dearborn Ave
- 23 Dearborn Ave
- 37 Alexander Dr
- 407 Lafayette Rd
- 8 Dunvegan Woods
- 28 Dunvegan Woods
- 65 Dunvegan Woods
- 93 Dunvegan Woods
- 41 Esker Rd
Your Personal Tour Guide
Ask me questions while you tour the home.